CometBFT QA Results v0.38.x
This iteration of the QA was run on CometBFT v0.38.0-alpha.2, the second
v0.38.x version from the CometBFT repository.
The changes with respect to the baseline, v0.37.0-alpha.3 from Feb 21, 2023,
include the introduction of the FinalizeBlock method to complete the full
range of ABCI++ functionality (ABCI 2.0), and other several improvements
described in the
CHANGELOG.
Issues discovered
- (critical, fixed) [#539] and [#546] - This bug causes the proposer to crash in
PrepareProposalbecause it does not have extensions while it should. This happens mainly when the proposer was catching up. - (critical, fixed) [#562] - There were several bugs in the metrics-related logic that were causing panics when the testnets were started.
200 Node Testnet
As in other iterations of our QA process, we have used a 200-node network as testbed, plus nodes to introduce load and collect metrics.
Saturation point
As in previous iterations of our QA experiments, we first find the transaction load on which the system begins to show a degraded performance. Then we run the experiments with the system subjected to a load slightly under the saturation point. The method to identify the saturation point is explained here and its application to the baseline is described here.
The following table summarizes the results for the different experiments
(extracted from
v038_report_tabbed.txt). The X axis
(c) is the number of connections created by the load runner process to the
target node. The Y axis (r) is the rate or number of transactions issued per
second.
| c=1 | c=2 | c=4 | |
|---|---|---|---|
| r=200 | 17800 | 33259 | 33259 |
| r=400 | 35600 | 41565 | 41384 |
| r=800 | 36831 | 38686 | 40816 |
| r=1600 | 40600 | 45034 | 39830 |
We can observe in the table that the system is saturated beyond the diagonal
defined by the entries c=1,r=400 and c=2,r=200. Entries in the diagonal have
the same amount of transaction load, so we can consider them equivalent. For the
chosen diagonal, the expected number of processed transactions is 1 * 400 tx/s * 89 s = 35600.
(Note that we use 89 out of 90 seconds of the experiment because the last transaction batch
coincides with the end of the experiment and is thus not sent.) The experiments in the diagonal
below expect double that number, that is, 1 * 800 tx/s * 89 s = 71200, but the
system is not able to process such load, thus it is saturated.
Therefore, for the rest of these experiments, we chose c=1,r=400 as the
configuration. We could have chosen the equivalent c=2,r=200, which is the same
used in our baseline version, but for simplicity we decided to use the one with
only one connection.
Also note that, compared to the previous QA tests, we have tried to find the
saturation point within a higher range of load values for the rate r. In
particular we run tests with r equal to or above 200, while in the previous
tests r was 200 or lower. In particular, for our baseline version we didn’t
run the experiment on the configuration c=1,r=400.
For comparison, this is the table with the baseline version, where the
saturation point is beyond the diagonal defined by r=200,c=2 and r=100,c=4.
| c=1 | c=2 | c=4 | |
|---|---|---|---|
| r=25 | 2225 | 4450 | 8900 |
| r=50 | 4450 | 8900 | 17800 |
| r=100 | 8900 | 17800 | 35600 |
| r=200 | 17800 | 35600 | 38660 |
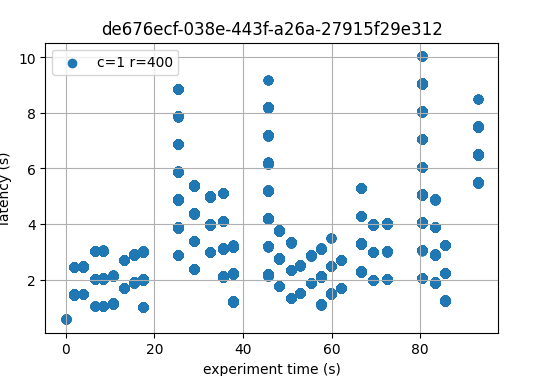
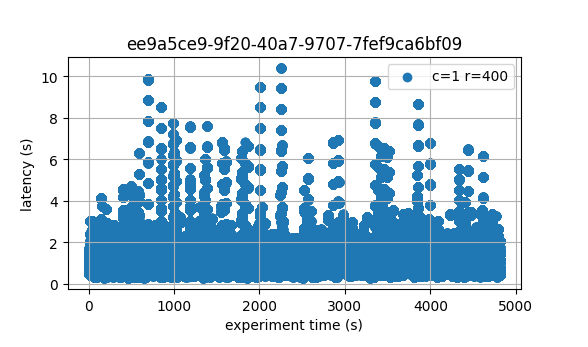
Latencies
The following figure plots the latencies of the experiment carried out with the
configuration c=1,r=400.
 .
.
For reference, the following figure shows the latencies of one of the
experiments for c=2,r=200 in the baseline.
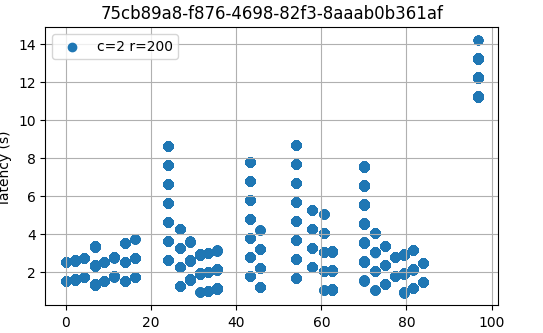
As can be seen, in most cases the latencies are very similar, and in some cases, the baseline has slightly higher latencies than the version under test. Thus, from this small experiment, we can say that the latencies measured on the two versions are equivalent, or at least that the version under test is not worse than the baseline.
Prometheus Metrics on the Chosen Experiment
This section further examines key metrics for this experiment extracted from
Prometheus data regarding the chosen experiment with configuration c=1,r=400.
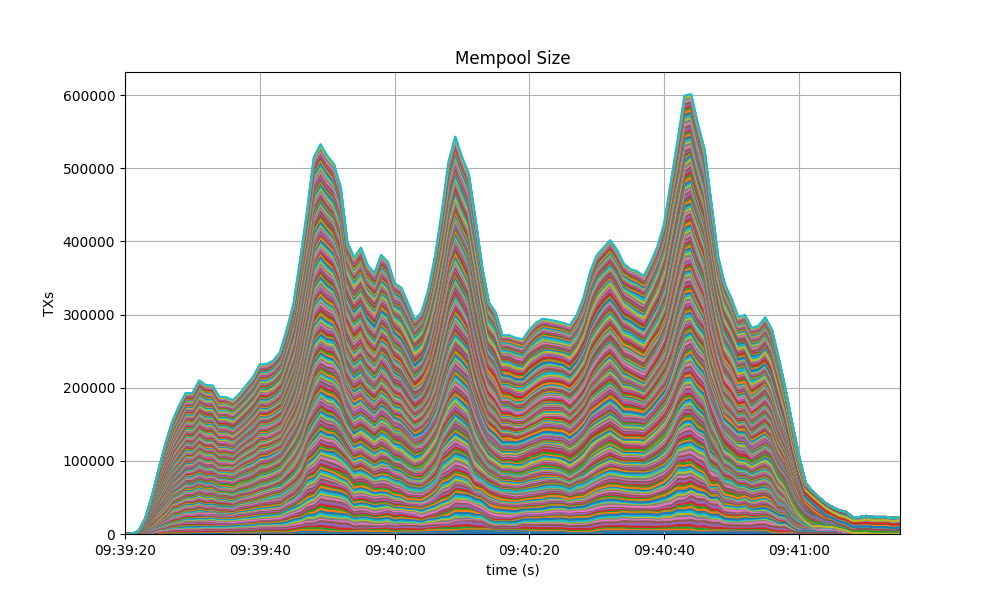
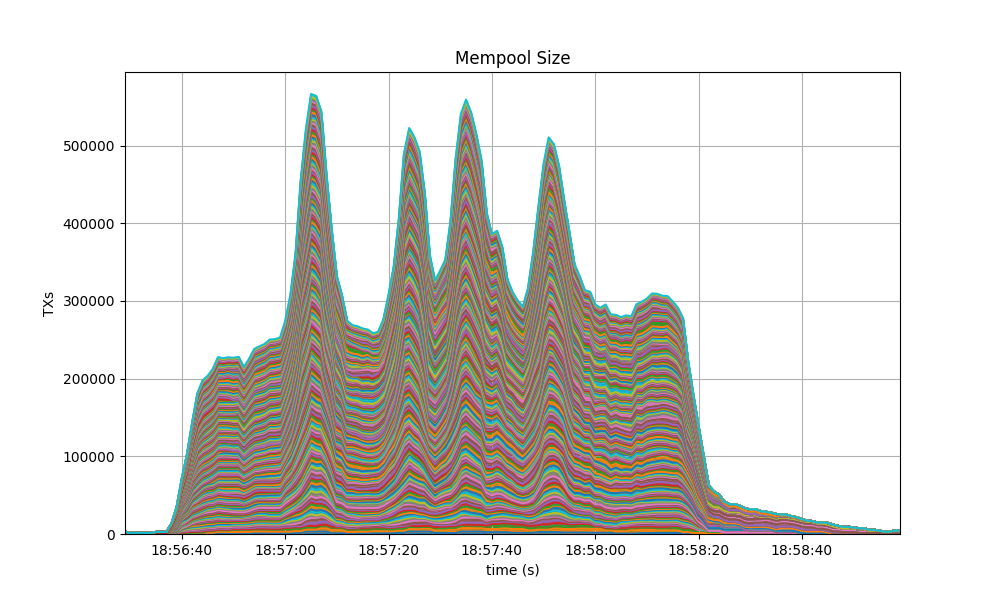
Mempool Size
The mempool size, a count of the number of transactions in the mempool, was shown to be stable and homogeneous at all full nodes. It did not exhibit any unconstrained growth. The plot below shows the evolution over time of the cumulative number of transactions inside all full nodes’ mempools at a given time.
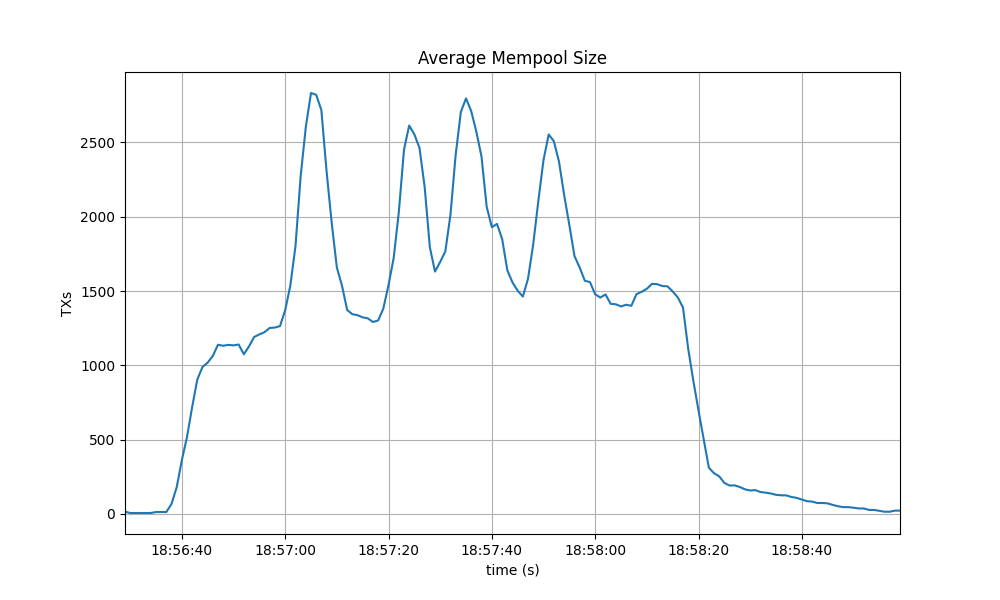
The following picture shows the evolution of the average mempool size over all full nodes, which mostly oscilates between 1000 and 2500 outstanding transactions.
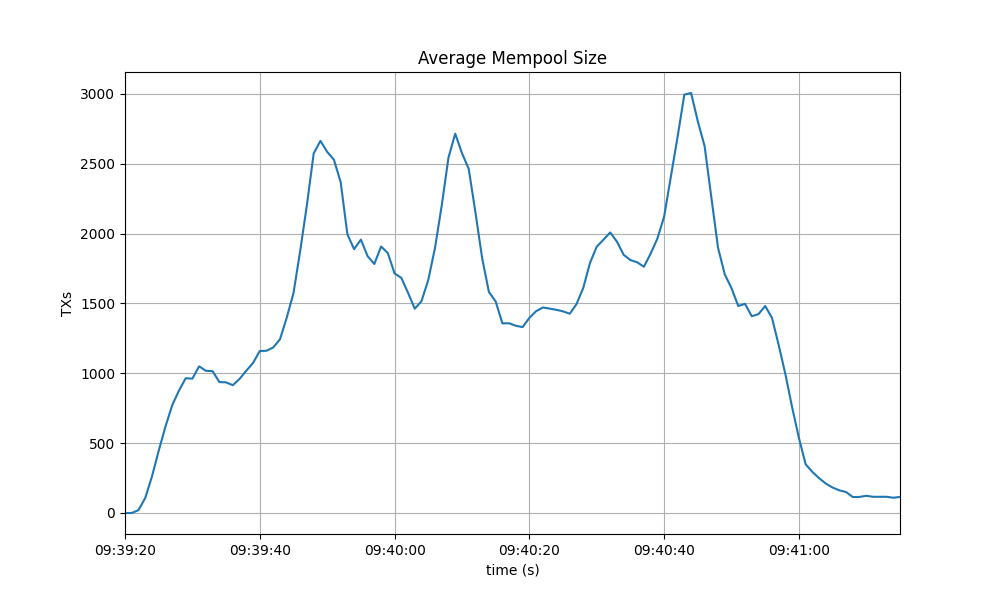
The peaks observed coincide with the moments when some nodes reached round 1 of consensus (see below).
The behavior is similar to the observed in the baseline, presented next.
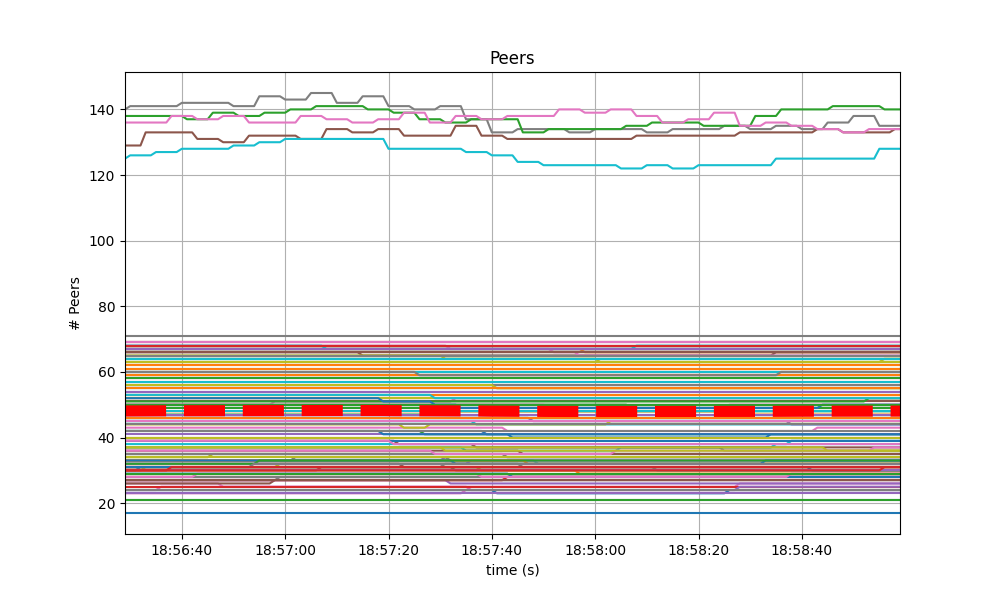
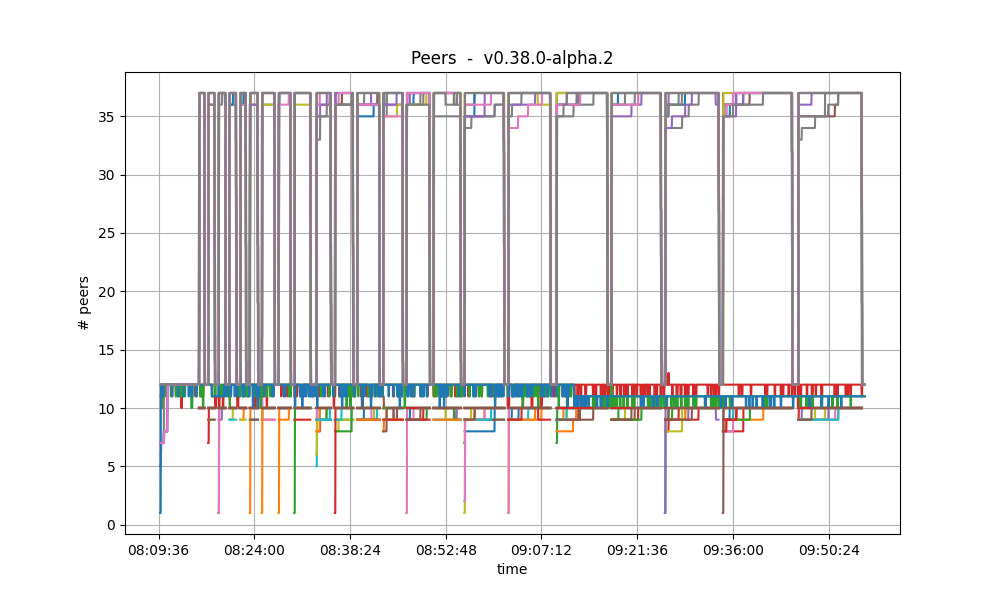
Peers
The number of peers was stable at all nodes. It was higher for the seed nodes (around 140) than for the rest (between 20 and 70 for most nodes). The red dashed line denotes the average value.
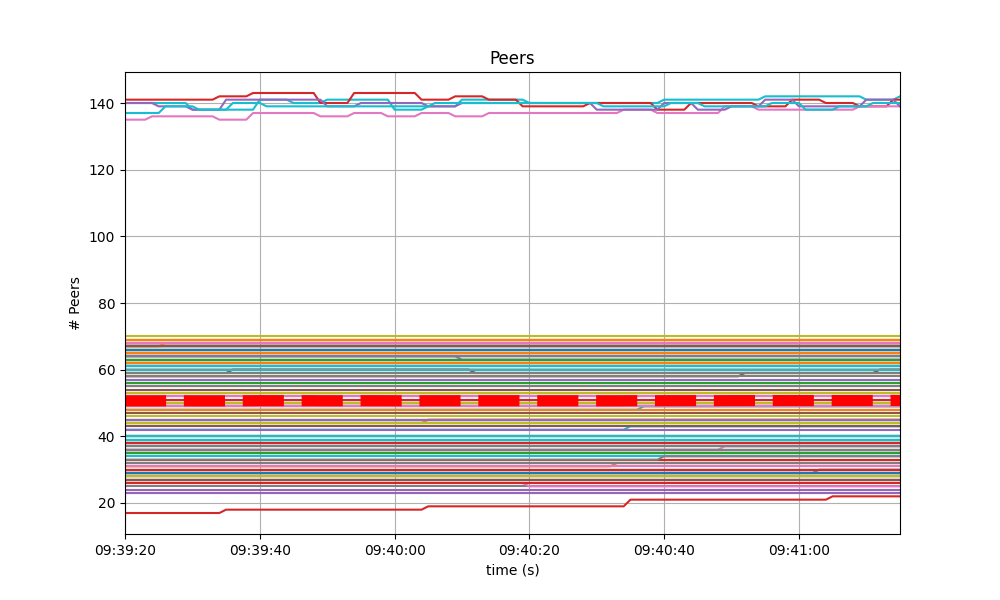
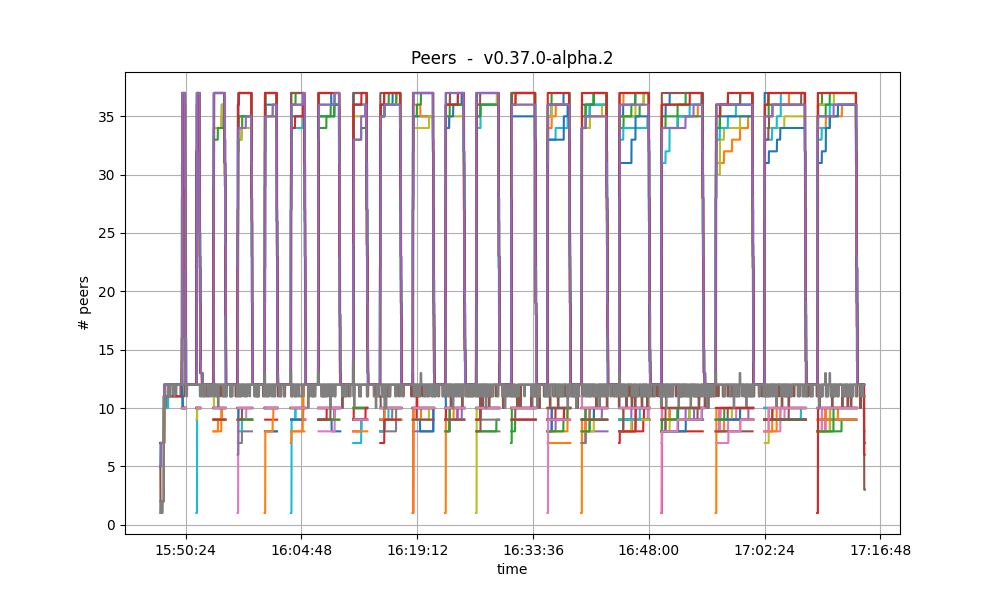
Just as in the baseline, shown next, the fact that non-seed nodes reach more than 50 peers is due to [#9548].
Consensus Rounds per Height
Most heights took just one round, that is, round 0, but some nodes needed to advance to round 1.
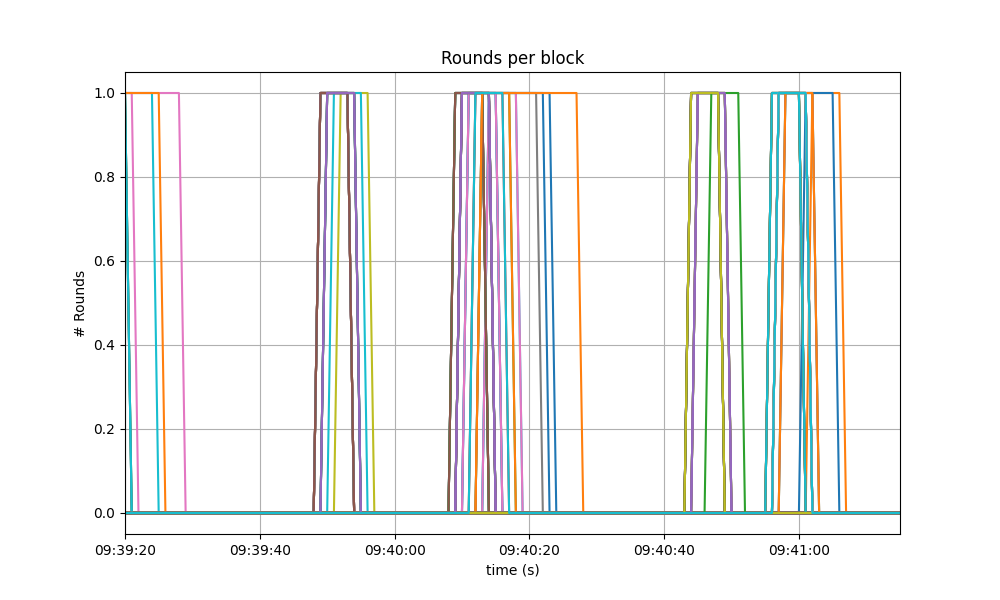
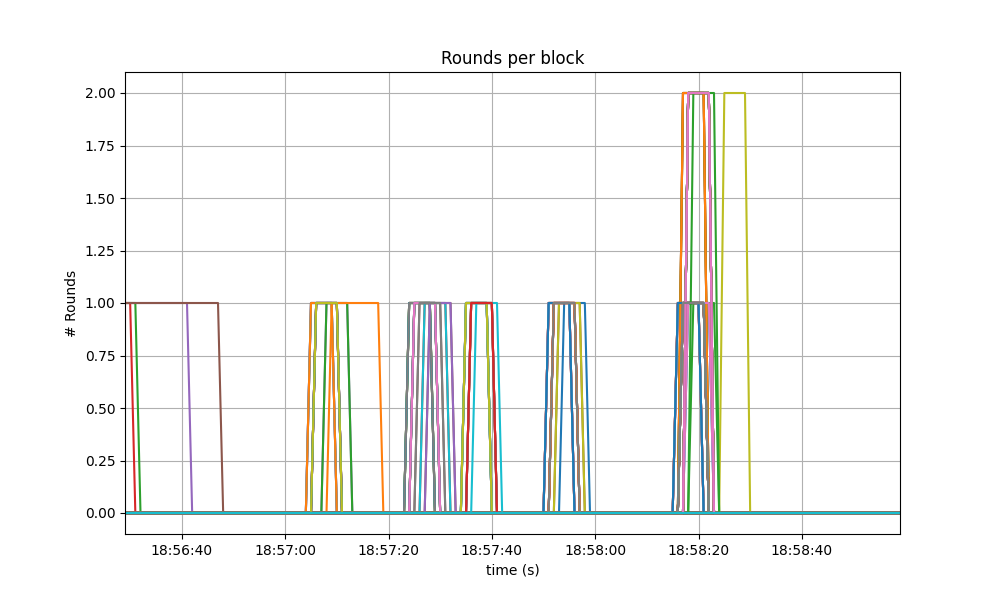
The following specific run of the baseline required some nodes to reach round 1.
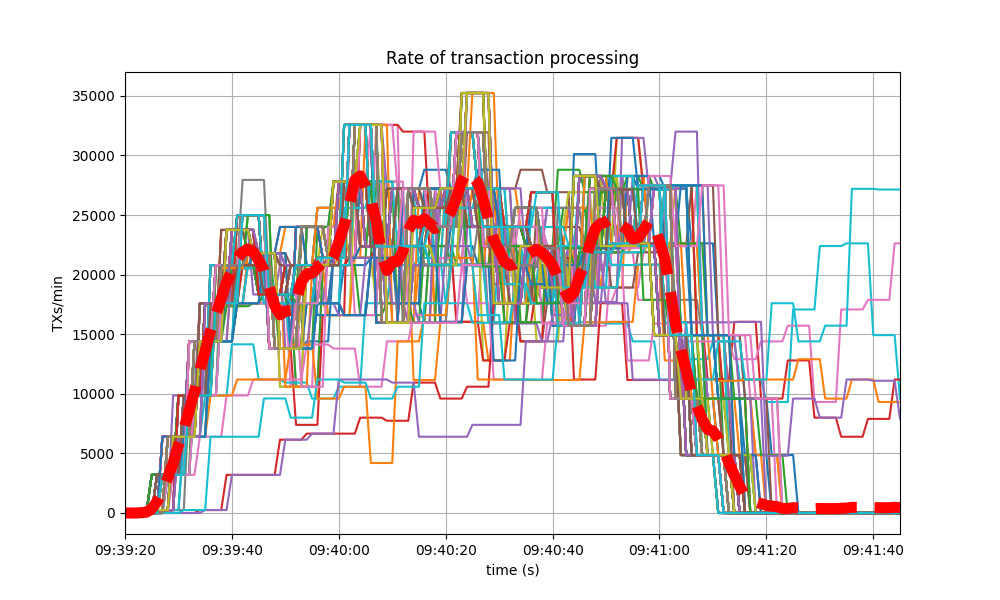
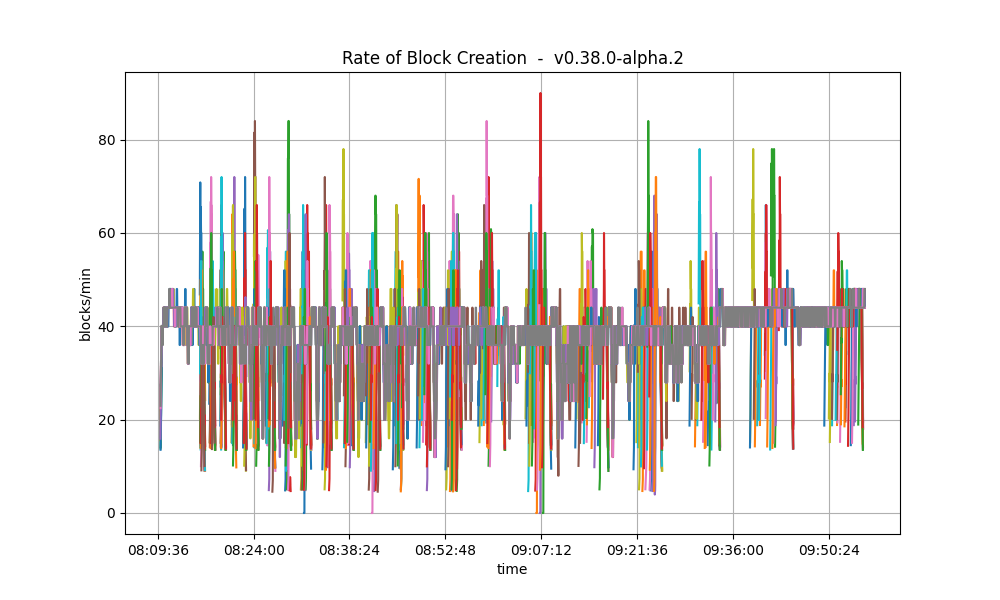
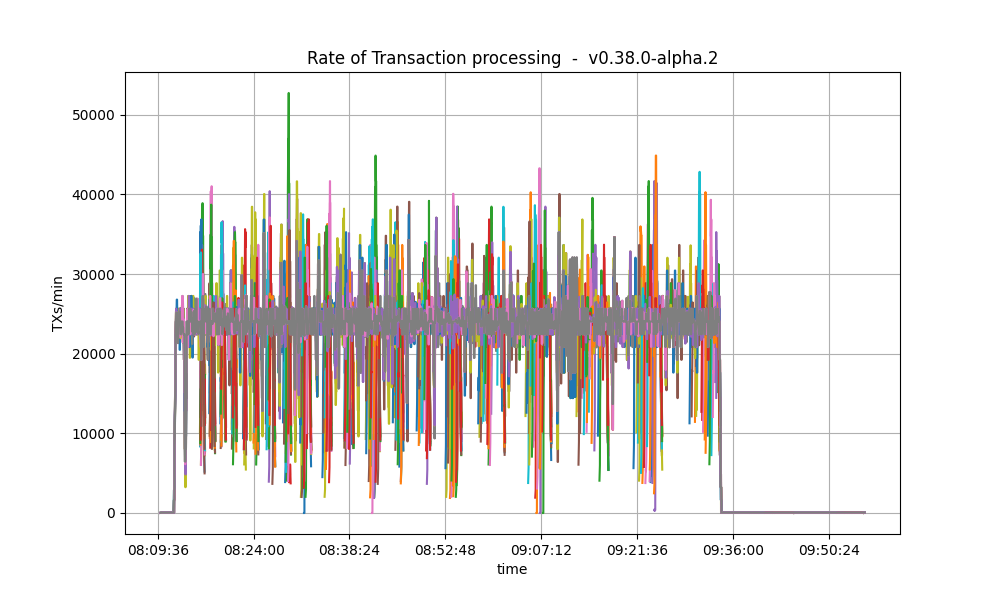
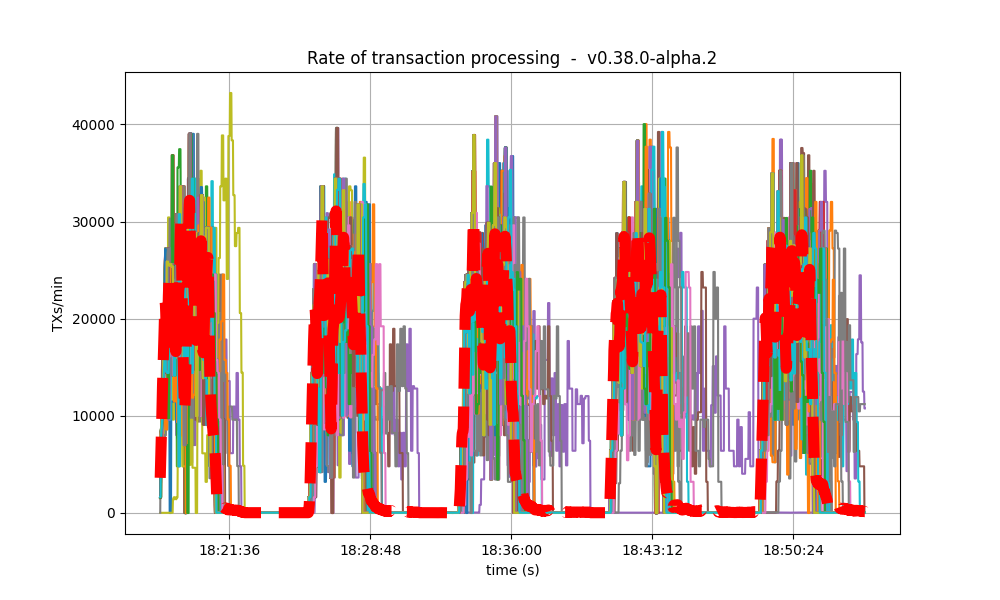
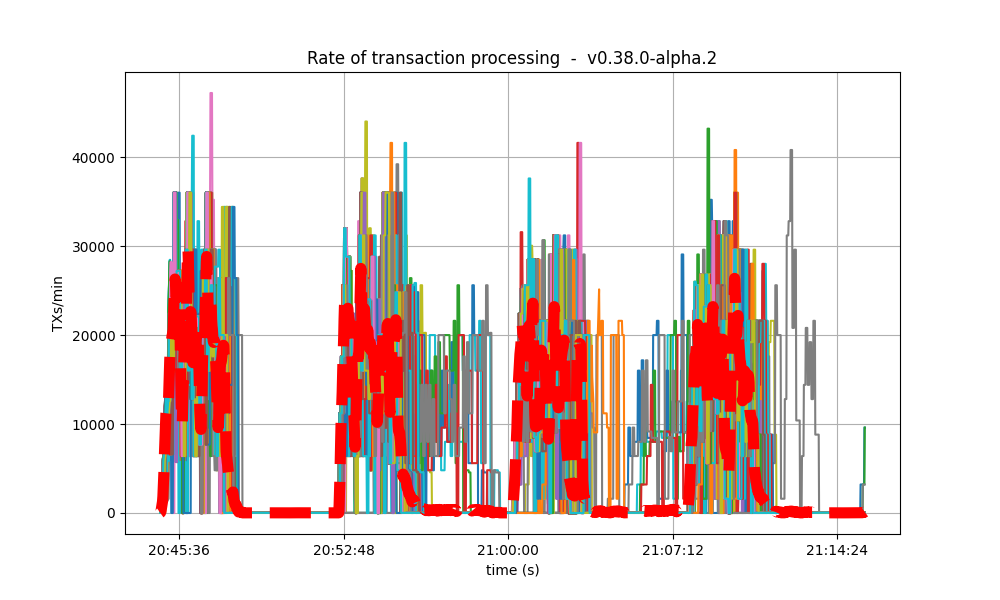
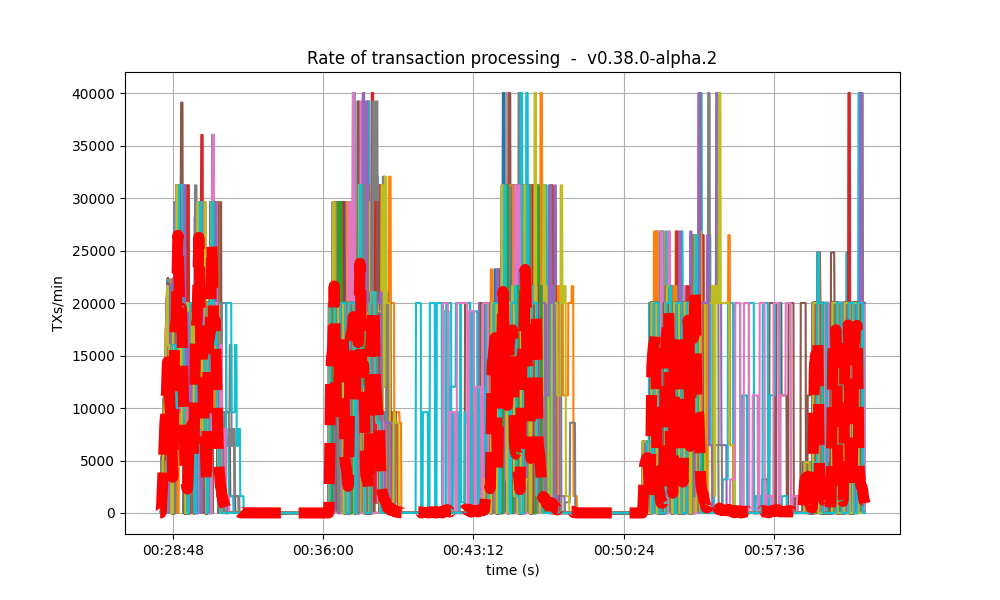
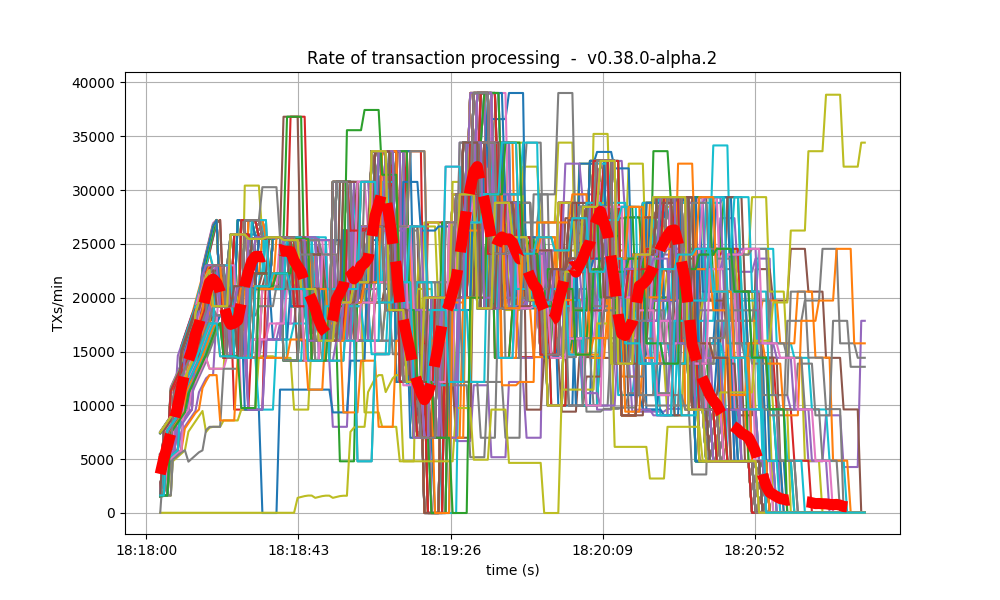
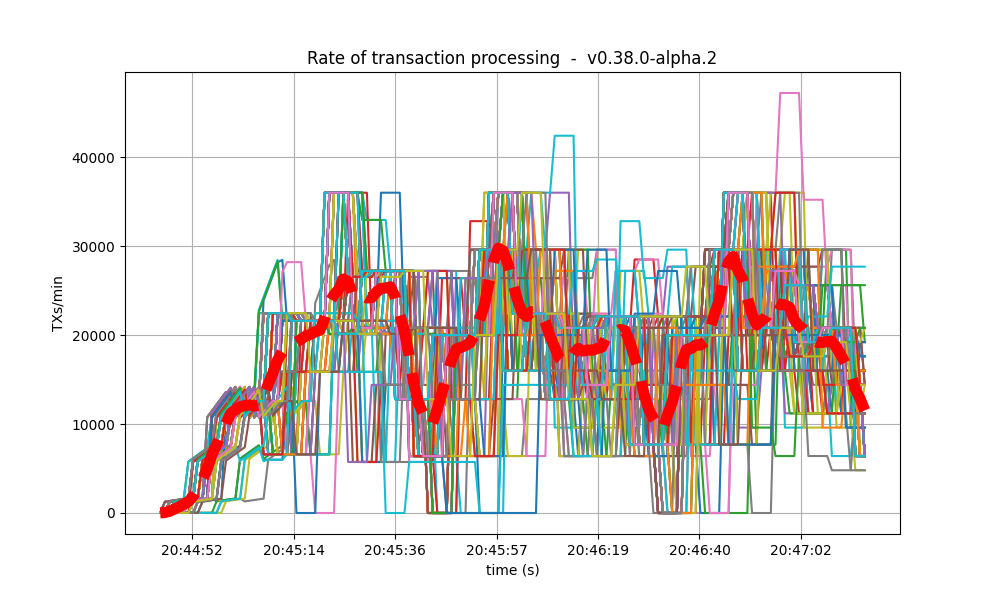
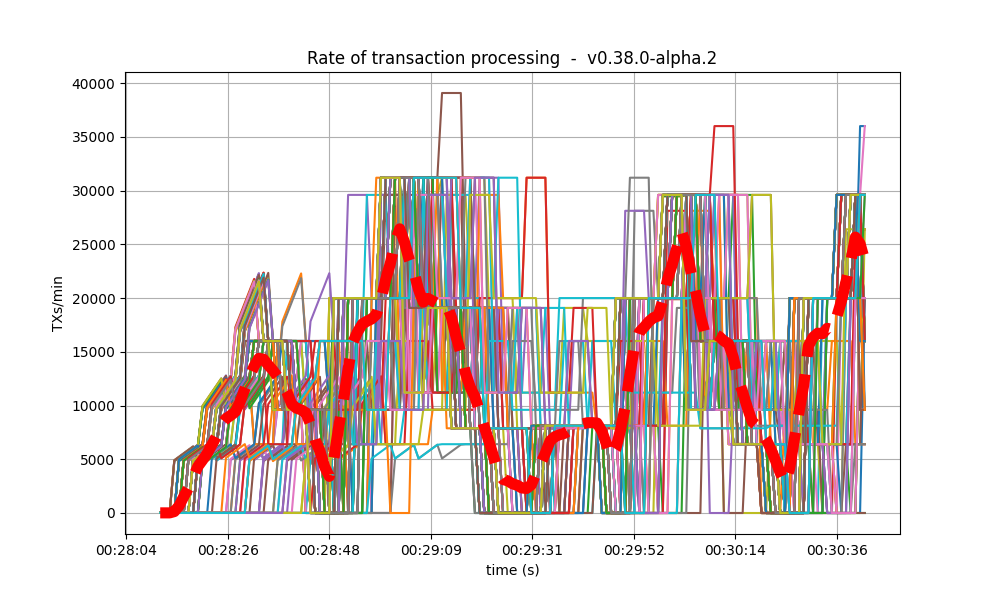
Blocks Produced per Minute, Transactions Processed per Minute
The following plot shows the rate in which blocks were created, from the point of view of each node. That is, it shows when each node learned that a new block had been agreed upon.
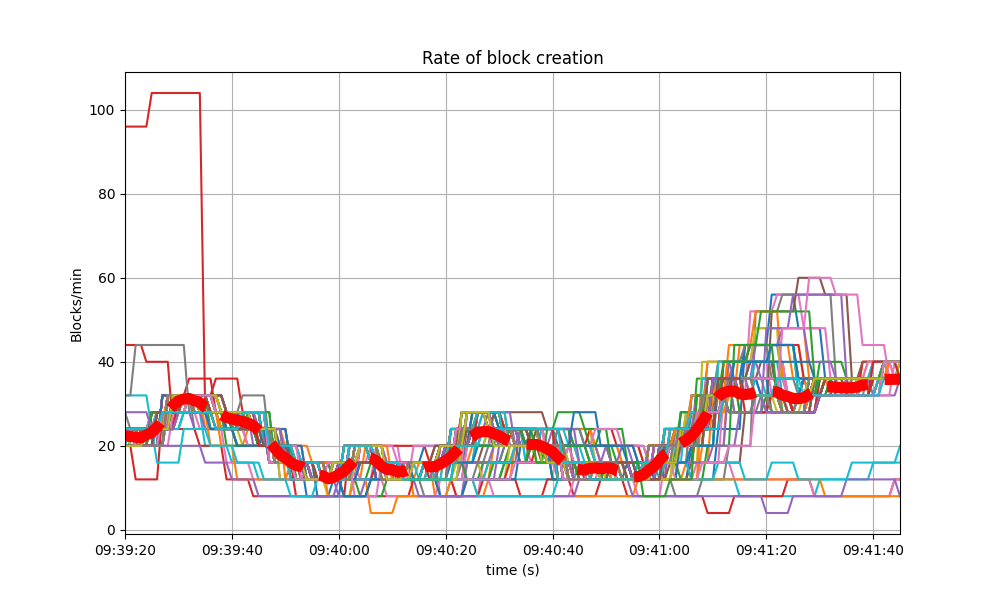
For most of the time when load was being applied to the system, most of the nodes stayed around 20 blocks/minute.
The spike to more than 100 blocks/minute is due to a slow node catching up.
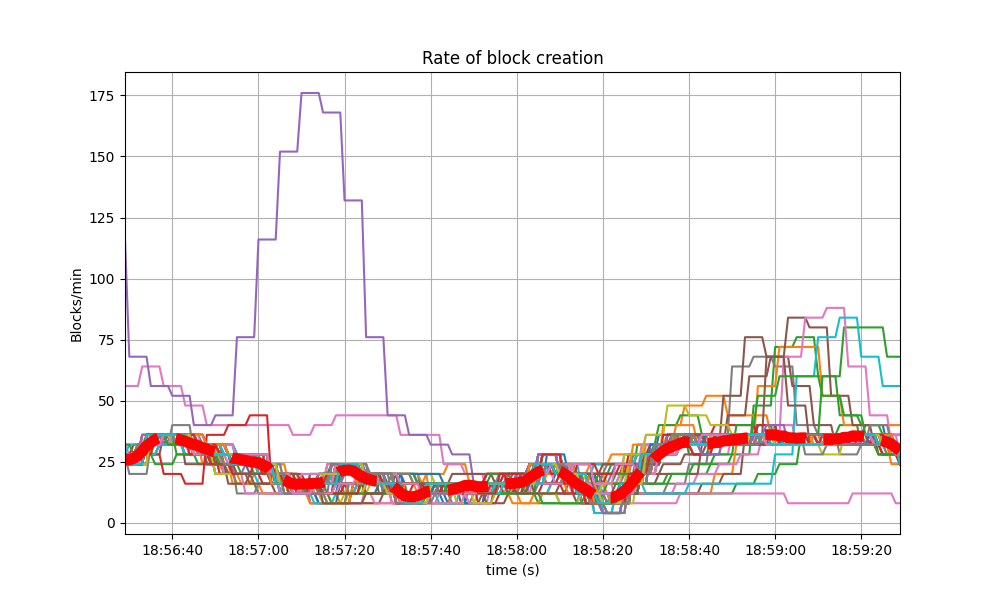
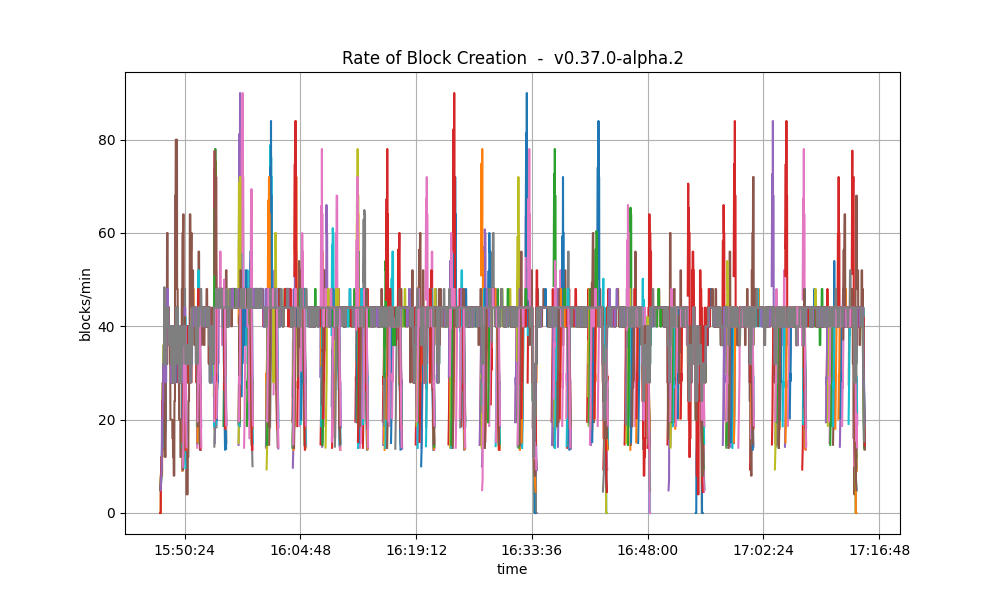
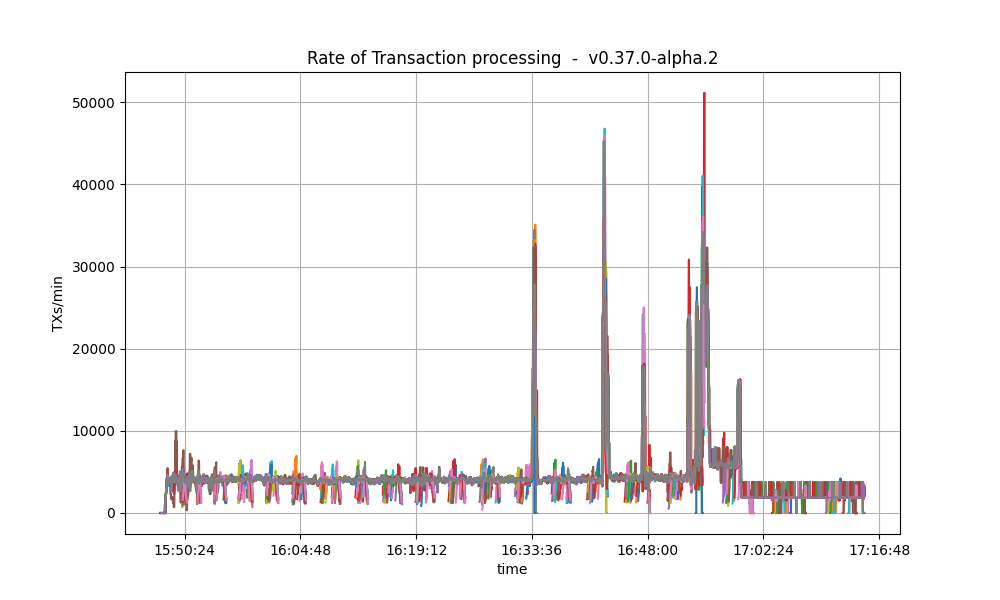
The baseline experienced a similar behavior.
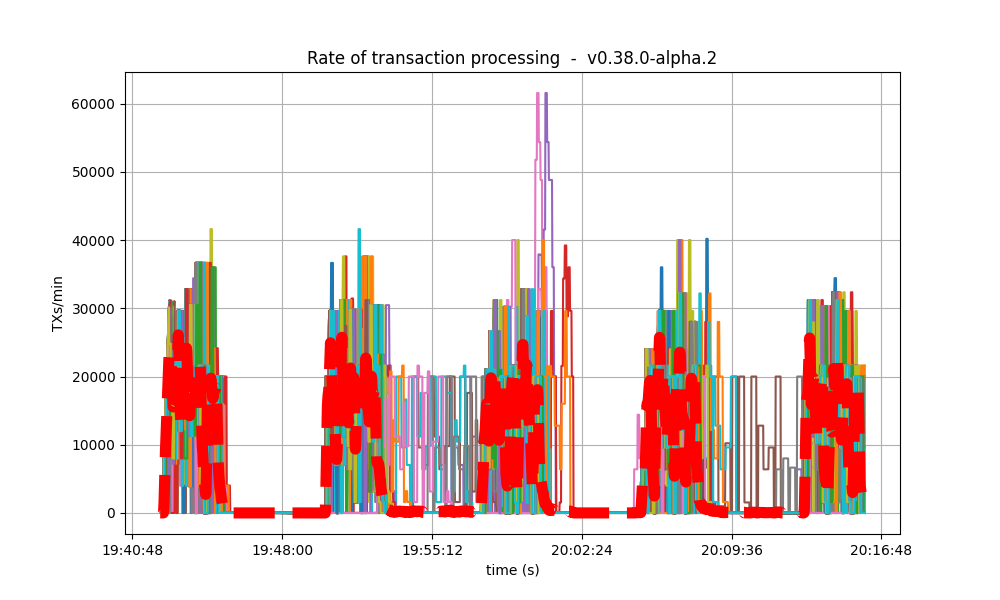
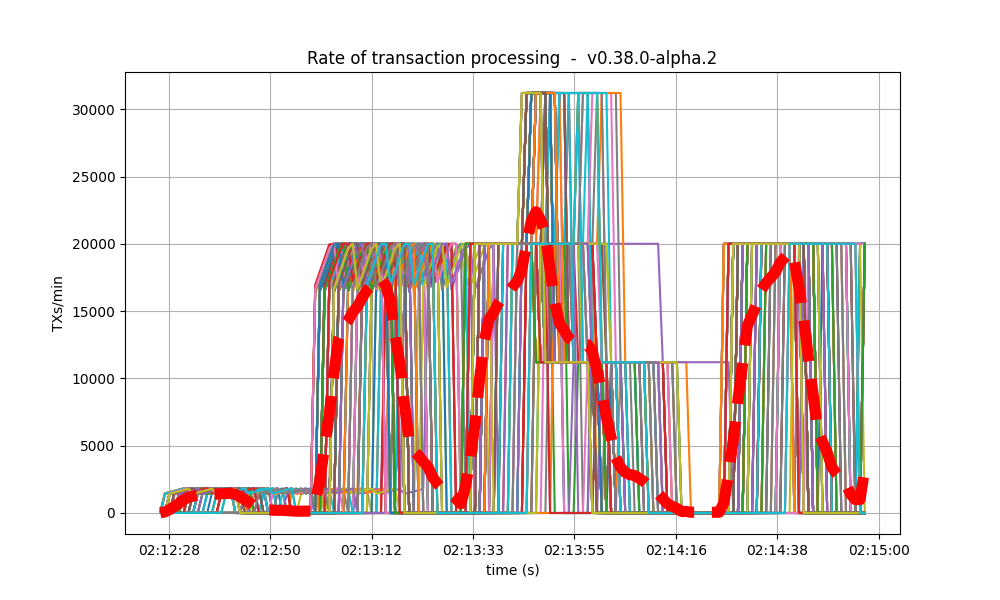
The collective spike on the right of the graph marks the end of the load injection, when blocks become smaller (empty) and impose less strain on the network. This behavior is reflected in the following graph, which shows the number of transactions processed per minute.
The following is the transaction processing rate of the baseline, which is similar to above.
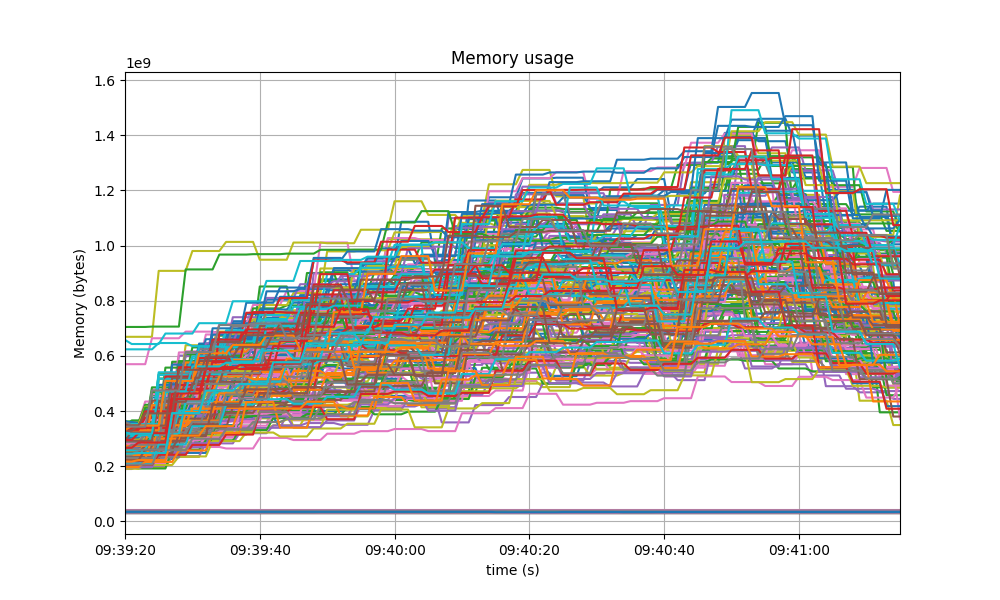
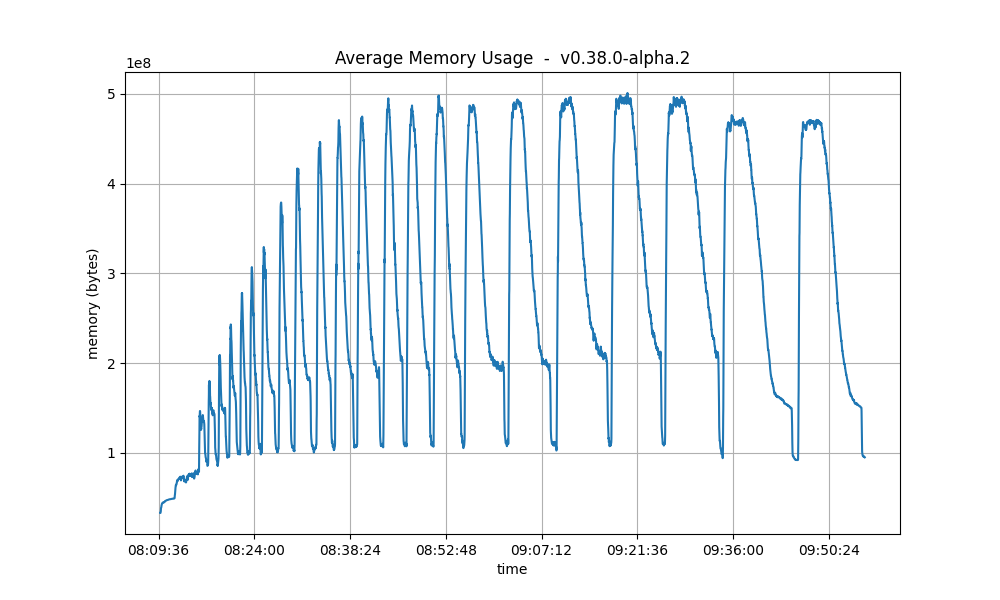
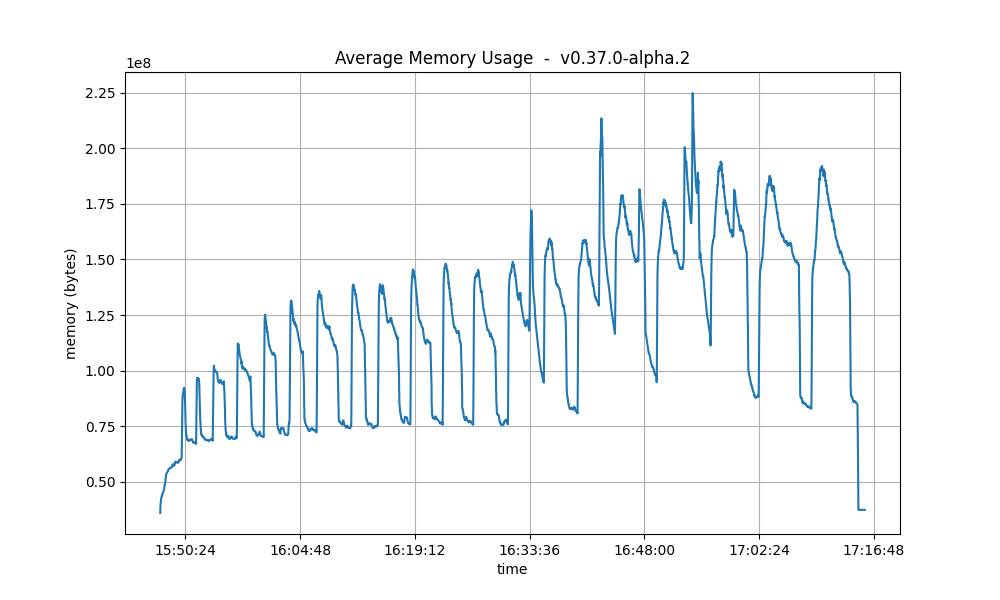
Memory Resident Set Size
The following graph shows the Resident Set Size of all monitored processes, with maximum memory usage of 1.6GB, slightly lower than the baseline shown after.
A similar behavior was shown in the baseline, with even a slightly higher memory usage.
The memory of all processes went down as the load is removed, showing no signs of unconstrained growth.
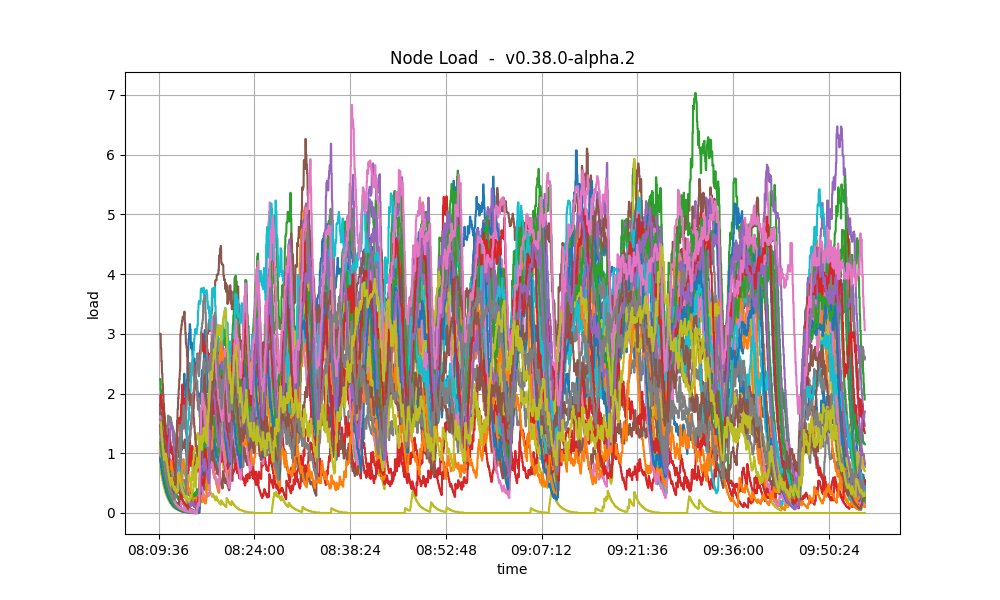
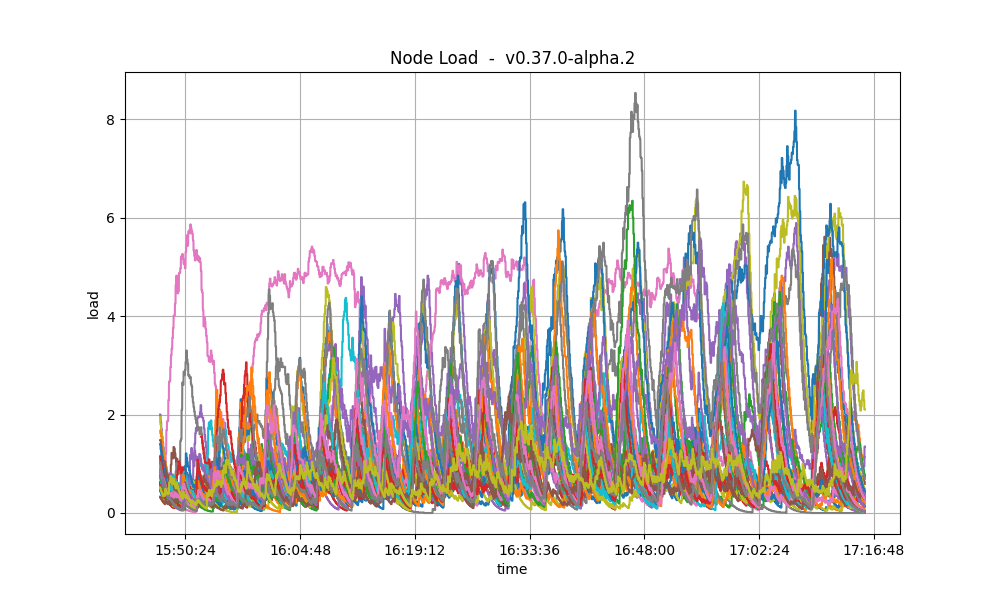
CPU utilization
Comparison to baseline
The best metric from Prometheus to gauge CPU utilization in a Unix machine is
load1, as it usually appears in the output of
top.
The load is contained below 5 on most nodes, as seen in the following graph.
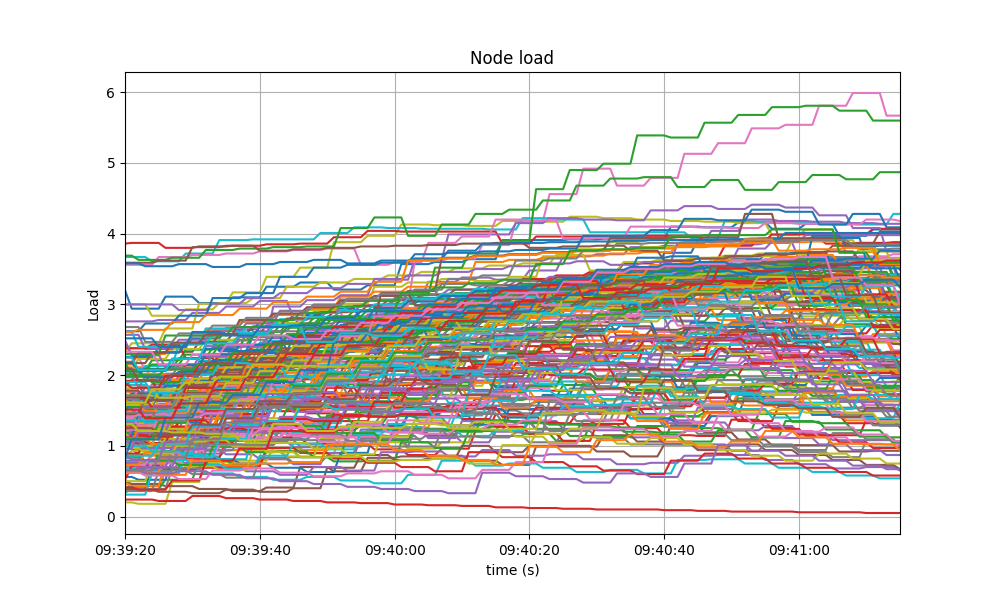
The baseline had a similar behavior.
Impact of vote extension signature verification
It is important to notice that the baseline (v0.37.x) does not implement vote extensions,
whereas the version under test (v0.38.0-alpha.2) does implement them, and they are
configured to be activated since height 1.
The e2e application used in these tests verifies all received vote extension signatures (up to 175)
twice per height: upon PrepareProposal (for sanity) and upon ProcessProposal (to demonstrate how
real applications can do it).
The fact that there is no noticeable difference in the CPU utilization plots of
the baseline and v0.38.0-alpha.2 means that re-verifying up 175 vote extension signatures twice
(besides the initial verification done by CometBFT when receiving them from the network)
has no performance impact in the current version of the system: the bottlenecks are elsewhere.
Thus, we should focus on optimizing other parts of the system: the ones that cause the current
bottlenecks (mempool gossip duplication, leaner proposal structure, optimized consensus gossip).
Test Results
The comparison against the baseline results show that both scenarios had similar numbers and are therefore equivalent.
A conclusion of these tests is shown in the following table, along with the commit versions used in the experiments.
| Scenario | Date | Version | Result |
|---|---|---|---|
| 200-node | 2023-05-21 | v0.38.0-alpha.2 (1f524d12996204f8fd9d41aa5aca215f80f06f5e) | Pass |
Rotating Node Testnet
We use c=1,r=400 as load, which can be considered a safe workload, as it was close to (but below)
the saturation point in the 200 node testnet. This testnet has less nodes (10 validators and 25 full nodes).
Importantly, the baseline considered in this section is v0.37.0-alpha.2 (Tendermint Core),
which is different from the one used in the previous section.
The reason is that this testnet was not re-tested for v0.37.0-alpha.3 (CometBFT),
since it was not deemed necessary.
Unlike in the baseline tests, the version of CometBFT used for these tests is not affected by [#9539],
which was fixed right after having run rotating testnet for v0.37.
As a result, the load introduced in this iteration of the test is higher as transactions do not get rejected.
Latencies
The plot of all latencies can be seen here.
Which is similar to the baseline.
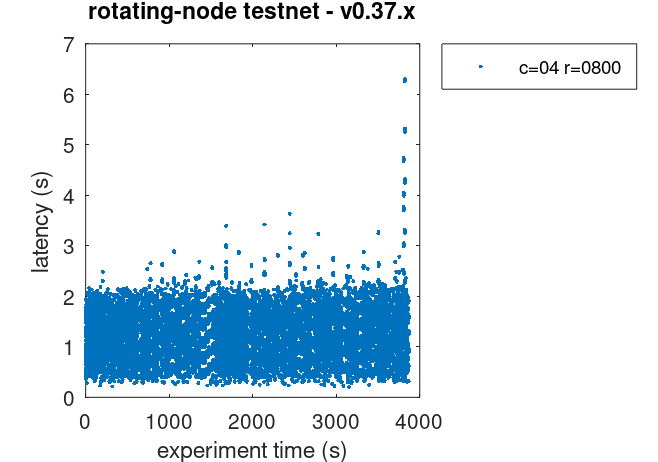
The average increase of about 1 second with respect to the baseline is due to the higher
transaction load produced (remember the baseline was affected by [#9539], whereby most transactions
produced were rejected by CheckTx).
Prometheus Metrics
The set of metrics shown here roughly match those shown on the baseline (v0.37) for the same experiment.
We also show the baseline results for comparison.
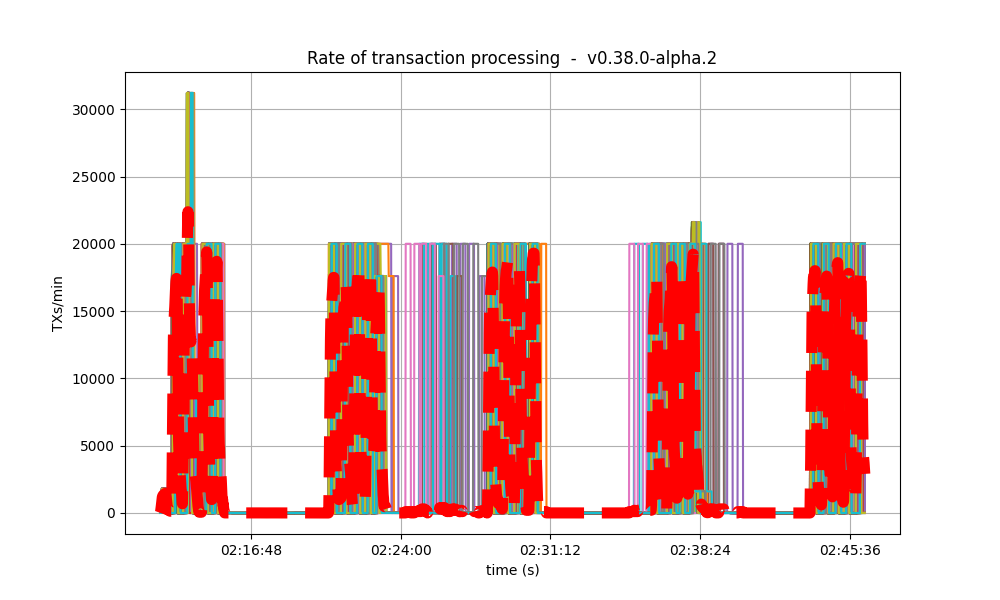
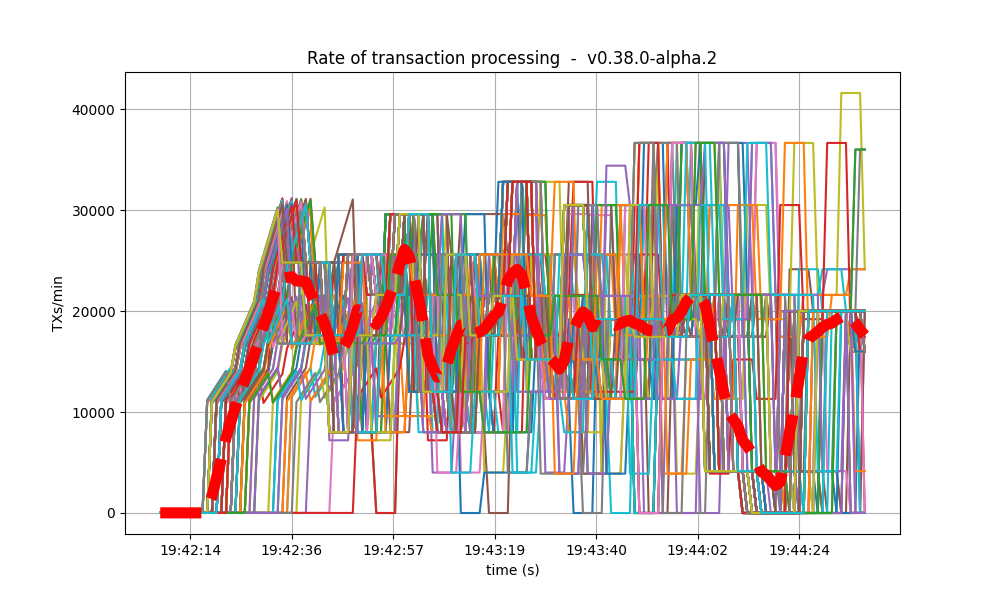
Blocks and Transactions per minute
This following plot shows the blocks produced per minute.
This is similar to the baseline, shown below.
The following plot shows only the heights reported by ephemeral nodes, both when they were blocksyncing and when they were running consensus. The second plot is the baseline plot for comparison. The baseline lacks the heights when the nodes were blocksyncing as that metric was implemented afterwards.
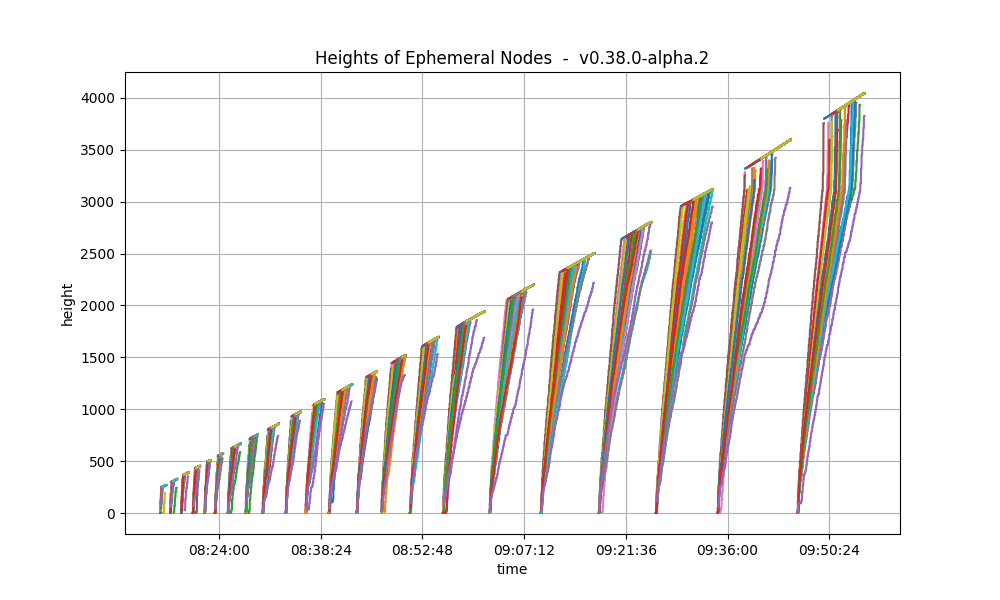
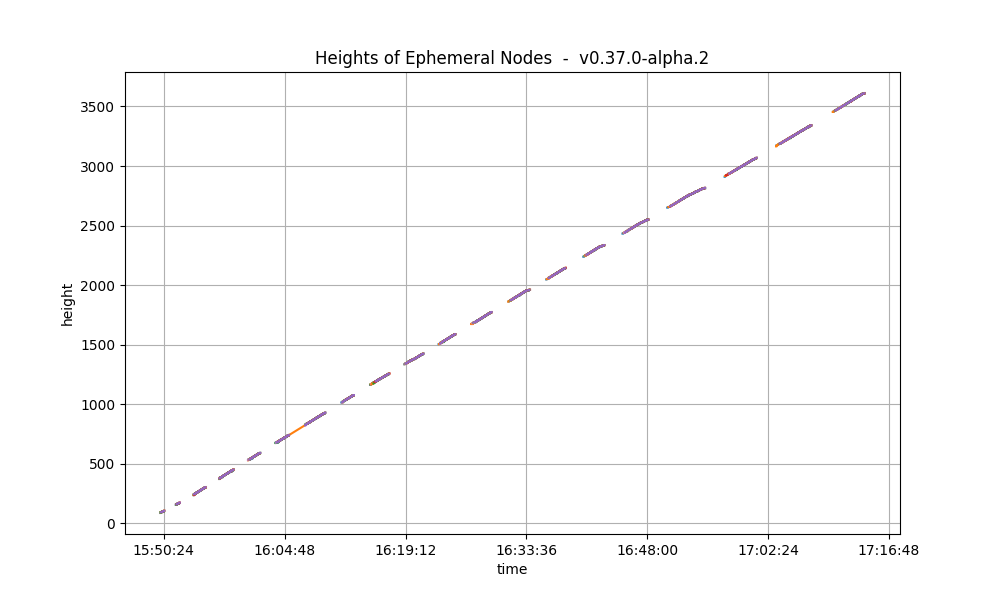
We seen that heights follow a similar pattern in both plots: they grow in length as the experiment advances.
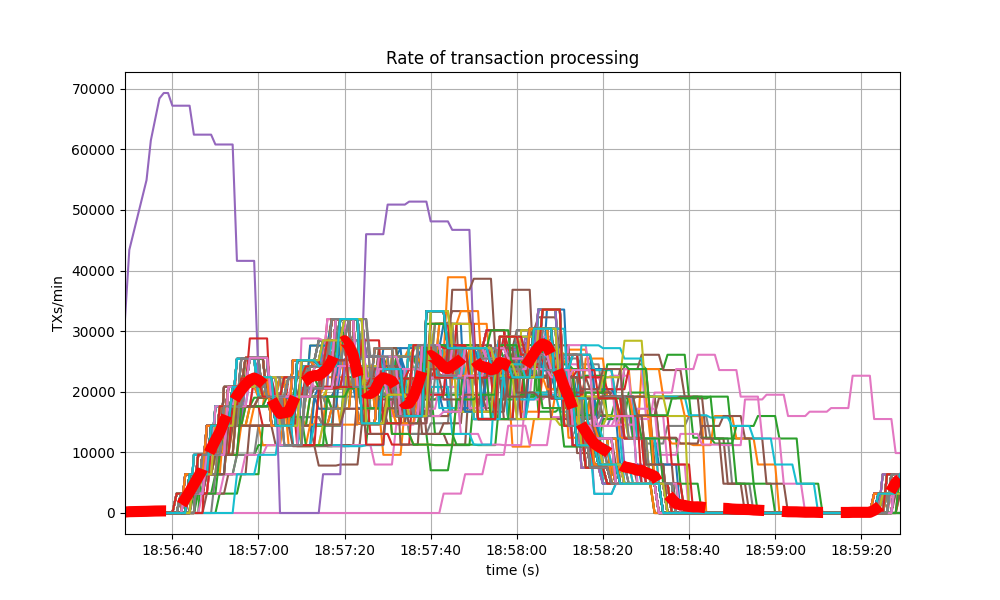
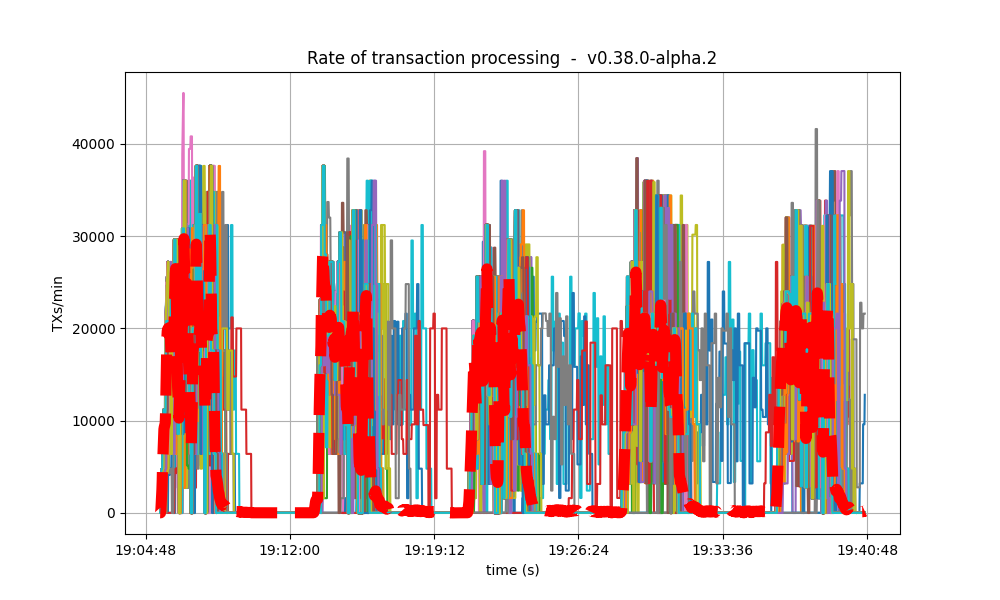
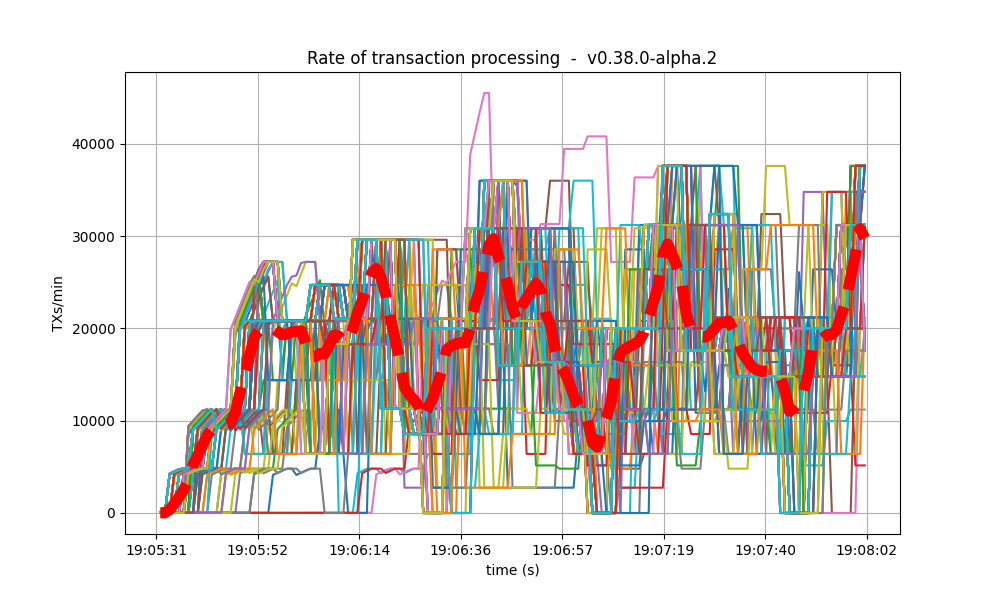
The following plot shows the transactions processed per minute.
For comparison, this is the baseline plot.
We can see the rate is much lower in the baseline plot.
The reason is that the baseline was affected by [#9539], whereby CheckTx rejected most transactions
produced by the load runner.
Peers
The plot below shows the evolution of the number of peers throughout the experiment.
This is the baseline plot, for comparison.
The plotted values and their evolution are comparable in both plots.
For further details on these plots, see the this section.
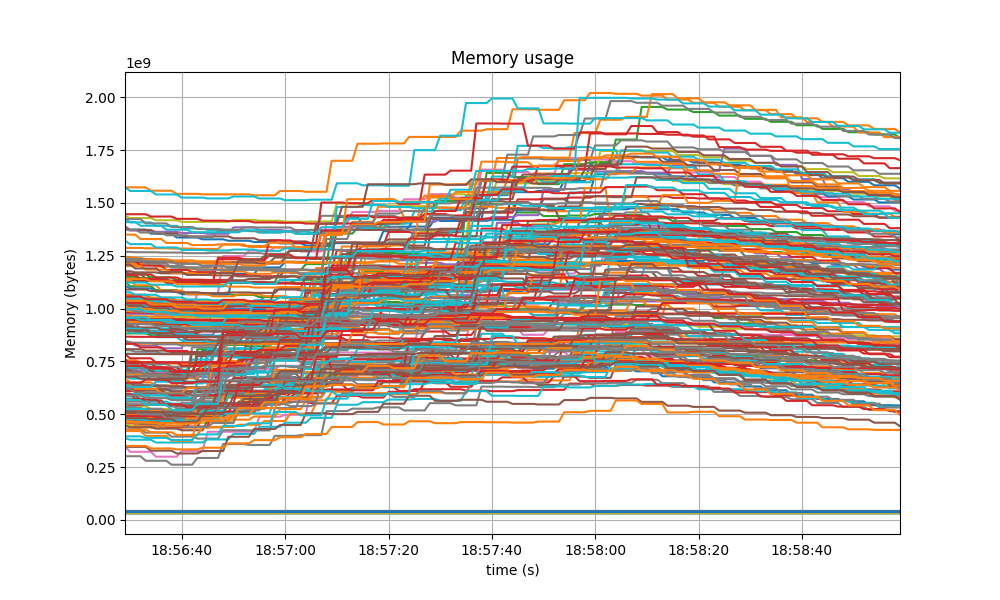
Memory Resident Set Size
The average Resident Set Size (RSS) over all processes is notably bigger on v0.38.0-alpha.2 than on the baseline.
The reason for this is, again, the fact that CheckTx was rejecting most transactions submitted on the baseline
and therefore the overall transaction load was lower on the baseline.
This is consistent with the difference seen in the transaction rate plots
in the previous section.
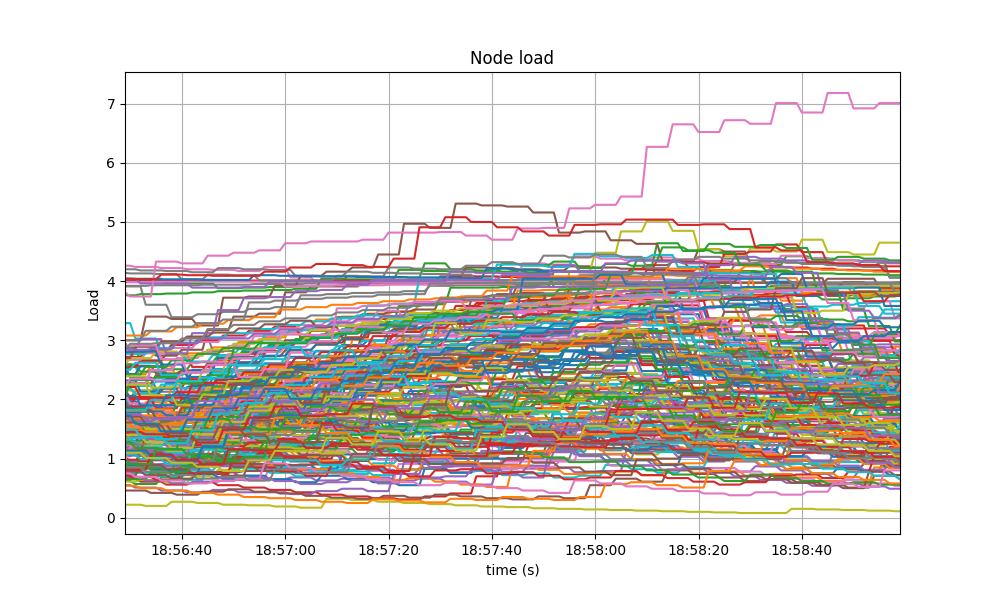
CPU utilization
The plots show metric load1 for all nodes for v0.38.0-alpha.2 and for the baseline.
In both cases, it is contained under 5 most of the time, which is considered normal load.
The load seems to be more important on v0.38.0-alpha.2 on average because of the bigger
number of transactions processed per minute as compared to the baseline.
Test Result
| Scenario | Date | Version | Result |
|---|---|---|---|
| Rotating | 2023-05-23 | v0.38.0-alpha.2 (e9abb116e29beb830cf111b824c8e2174d538838) | Pass |
Vote Extensions Testbed
In this testnet we evaluate the effect of varying the sizes of vote extensions added to pre-commit votes on the performance of CometBFT. The test uses the Key/Value store in our [end-to-end] test framework, which has the following simplified flow:
- When validators send their pre-commit votes to a block of height $i$, they first extend the vote as they see fit in
ExtendVote. - When a proposer for height $i+1$ creates a block to propose, in
PrepareProposal, it prepends the transactions with a special transaction, which modifies a reserved key. The transaction value is derived from the extensions from height $i$; in this example, the value is derived from the vote extensions and includes the set itself, hexa encoded as string. - When a validator sends their pre-vote for the block proposed in $i+1$, they first double check in
ProcessProposalthat the special transaction in the block was properly built by the proposer. - When validators send their pre-commit for the block proposed in $i+1$, they first extend the vote, and the steps repeat for heights $i+2$ and so on.
For this test, extensions are random sequences of bytes with a predefined vote_extension_size.
Hence, two effects are seen on the network.
First, pre-commit vote message sizes will increase by the specified vote_extension_size and, second, block messages will increase by twice vote_extension_size, given then hexa encoding of extensions, times the number of extensions received, i.e. at least 2/3 of 175.
All tests were performed on commit d5baba237ab3a04c1fd4a7b10927ba2e6a2aab27, which corresponds to v0.38.0-alpha.2 plus commits to add the ability to vary the vote extension sizes to the test application.
Although the same commit is used for the baseline, in this configuration the behavior observed is the same as in the “vanilla” v0.38.0-alpha.2 test application, that is, vote extensions are 8-byte integers, compressed as variable size integers instead of a random sequence of size vote_extension_size.
The following table summarizes the test cases.
| Name | Extension Size (bytes) | Date |
|---|---|---|
| baseline | 8 (varint) | 2023-05-26 |
| 2k | 2048 | 2023-05-29 |
| 4k | 4094 | 2023-05-29 |
| 8k | 8192 | 2023-05-26 |
| 16k | 16384 | 2023-05-26 |
| 32k | 32768 | 2023-05-26 |
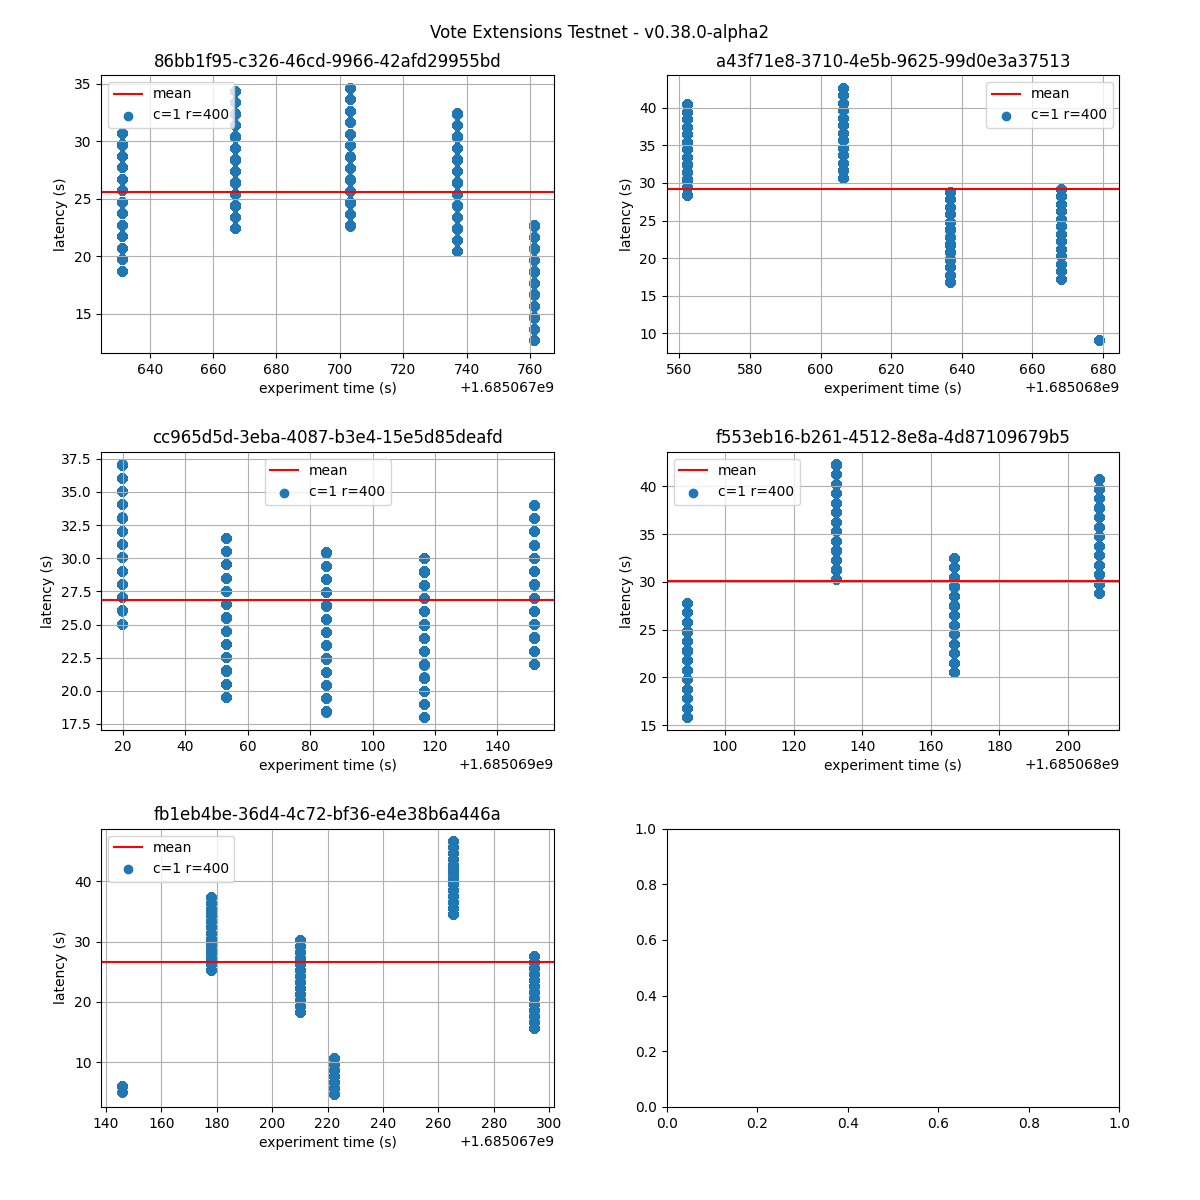
Latency
The following figures show the latencies observed on each of the 5 runs of each experiment; the redline shows the average of each run. It can be easily seen from these graphs that the larger the vote extension size, the more latency varies and the more common higher latencies become. Even in the case of extensions of size 2k, the mean latency goes from below 5s to nearly 10s.
Baseline
2k
4k
8k
16k

32k
The following graphs combine all the runs of the same experiment. They show that latency variation greatly increases with the increase of vote extensions. In particular, for the 16k and 32k cases, the system goes through large gaps without transaction delivery. As discussed later, this is the result of heights taking multiple rounds to finish and new transactions being held until the next block is agreed upon.
baseline 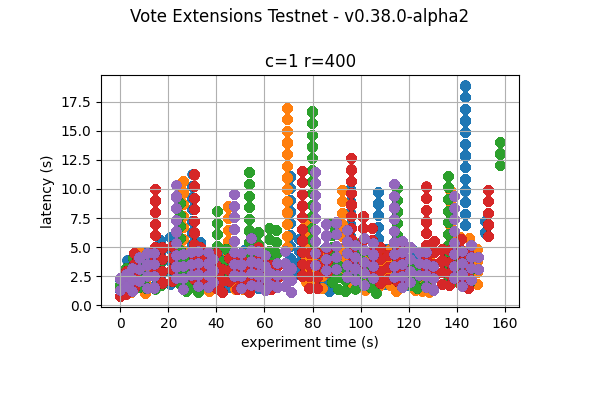 |
2k 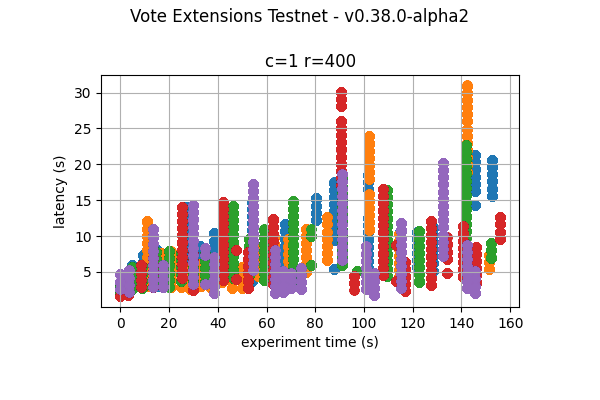 |
4k 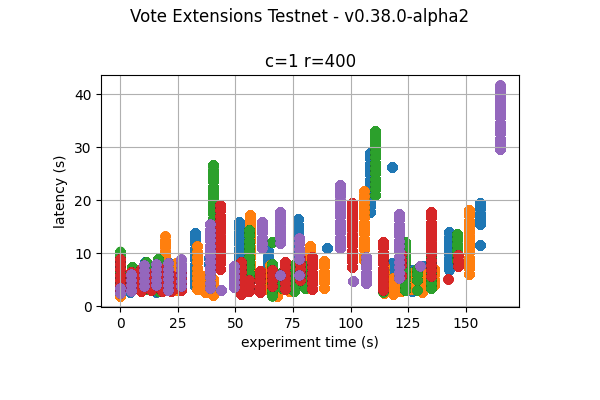 |
8k 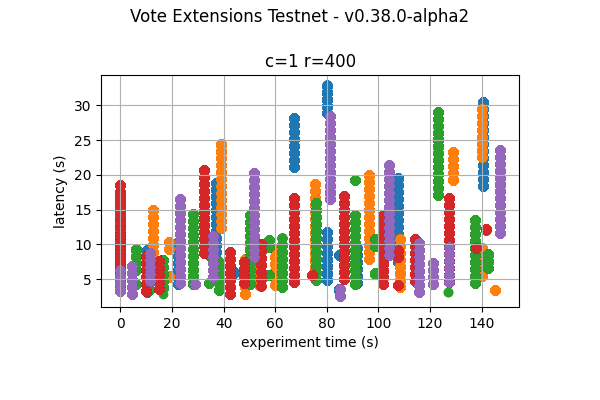 |
16k 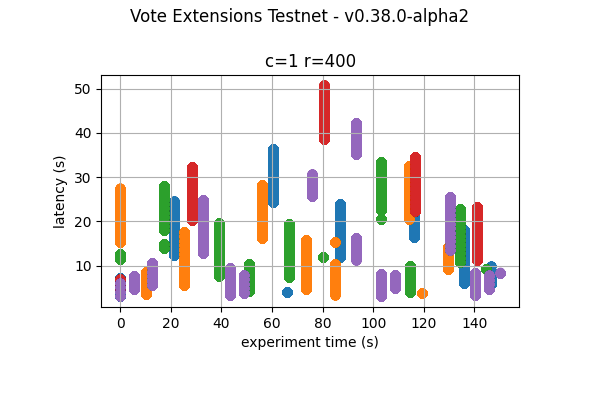 |
32k 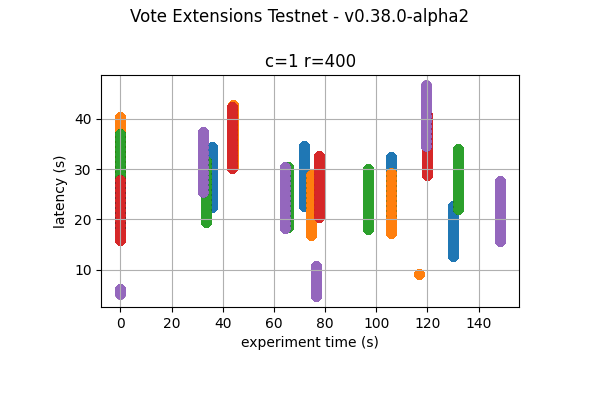 |
Blocks and Transactions per minute
The following plots show the blocks produced per minute and transactions processed per minute. We have divided the presentation in an overview section, which shows the metrics for the whole experiment (five runs) and a detailed sample, which shows the metrics for the first of the five runs. We repeat the approach for the other metrics as well. The dashed red line shows the moving average over a 20s window.
Overview
It is clear from the overview plots that as the vote extension sizes increase, the rate of block creation decreases. Although the rate of transaction processing also decreases, it does not seem to decrease as fast.
| Experiment | Block creation rate | Transaction rate |
|---|---|---|
| baseline |  |
 |
| 2k | 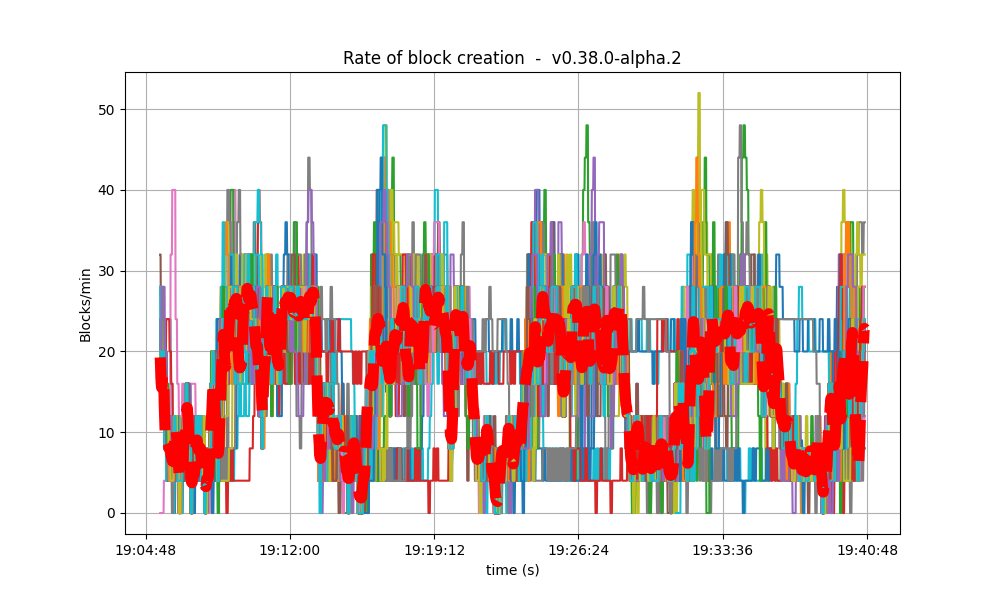 |
 |
| 4k | 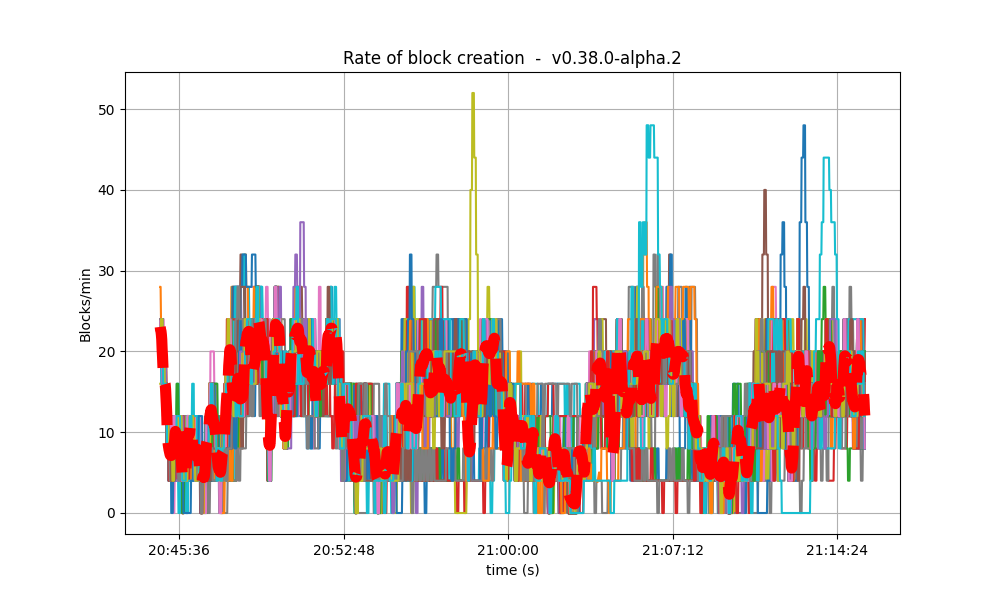 |
 |
| 8k | 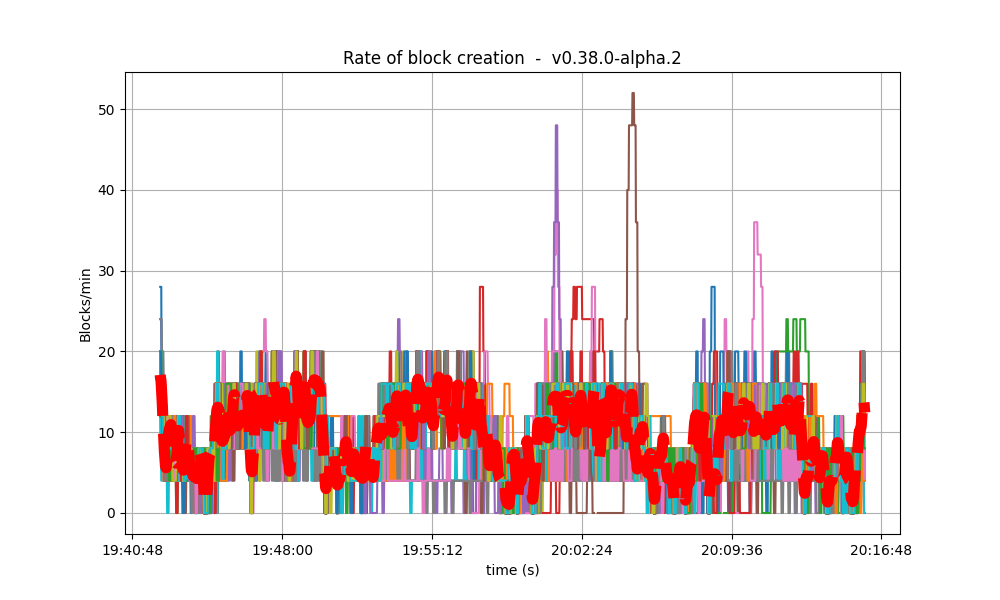 |
 |
| 16k | 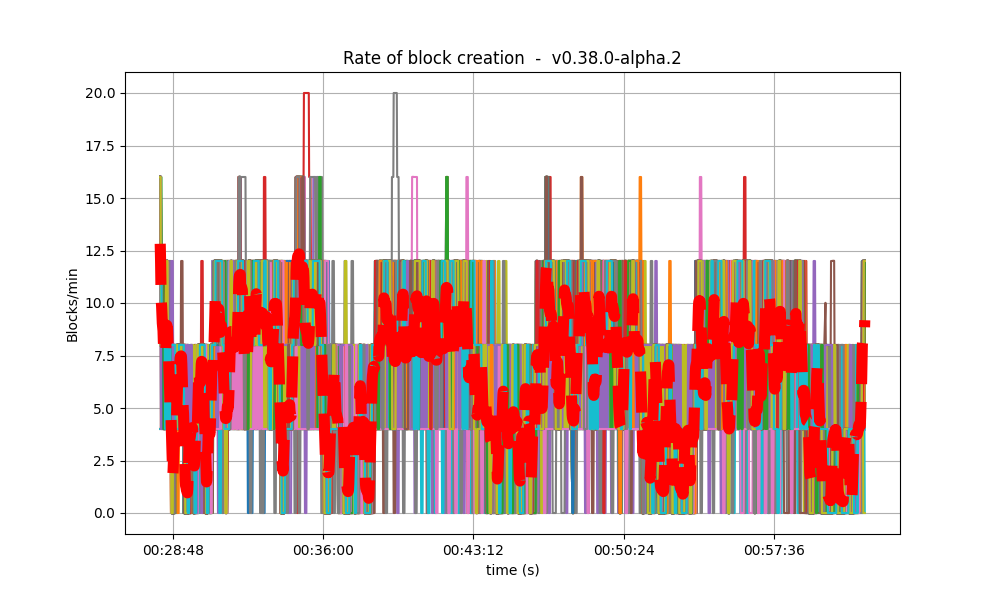 |
 |
| 32k | 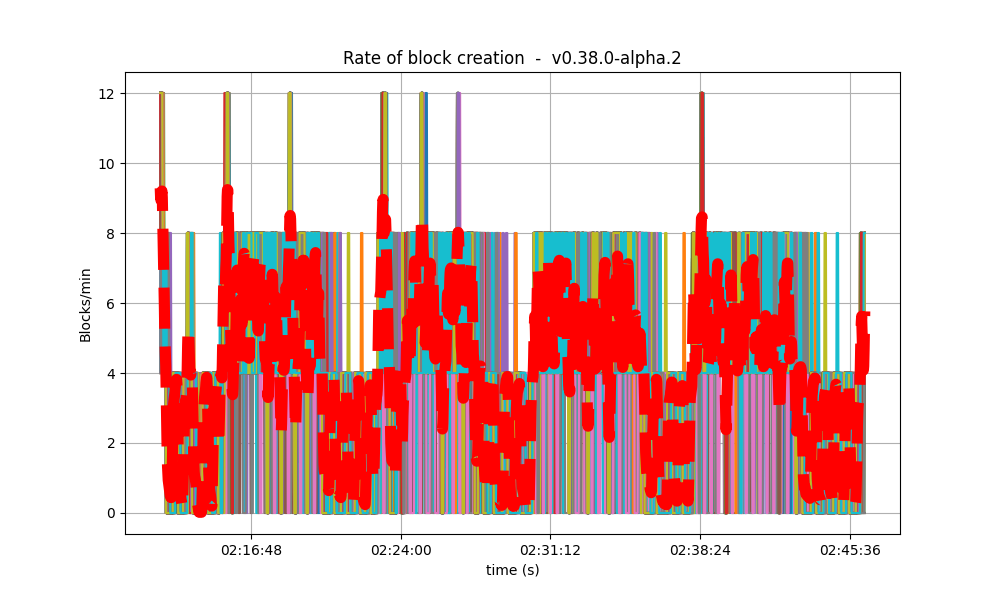 |
 |
First run
| Experiment | Block creation rate | Transaction rate |
|---|---|---|
| baseline | 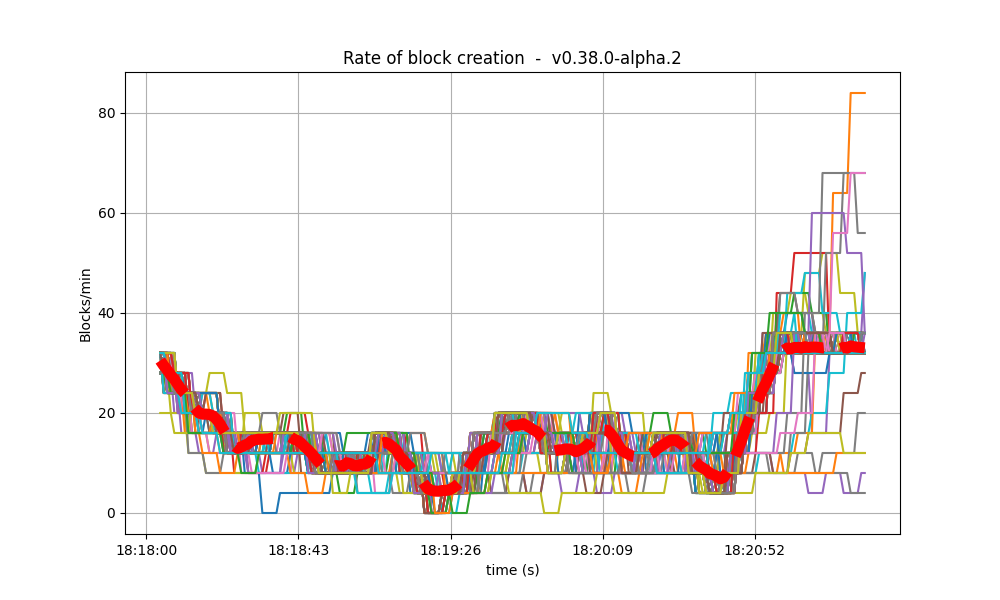 |
 |
| 2k | 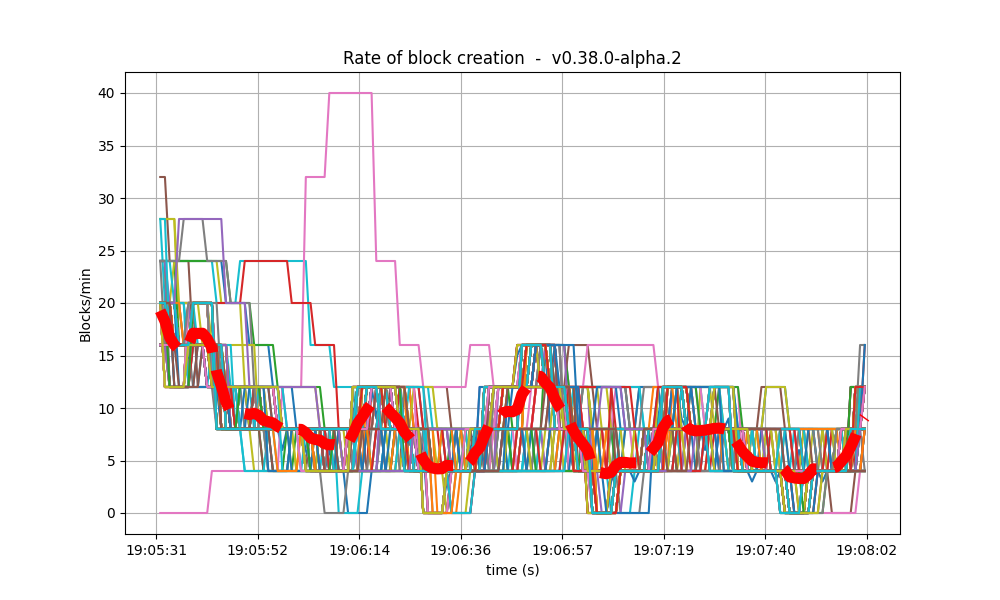 |
 |
| 4k | 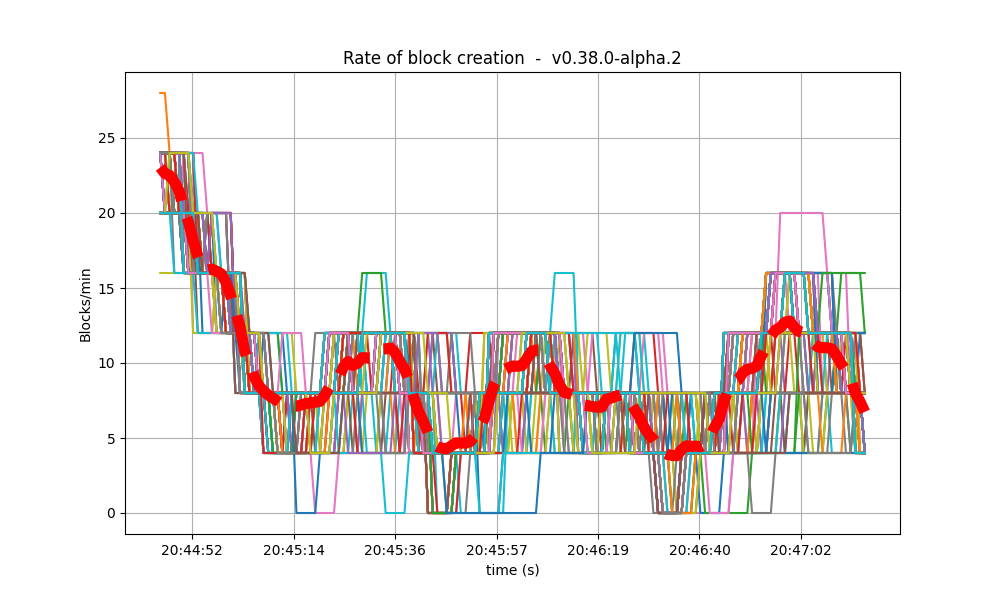 |
 |
| 8k | 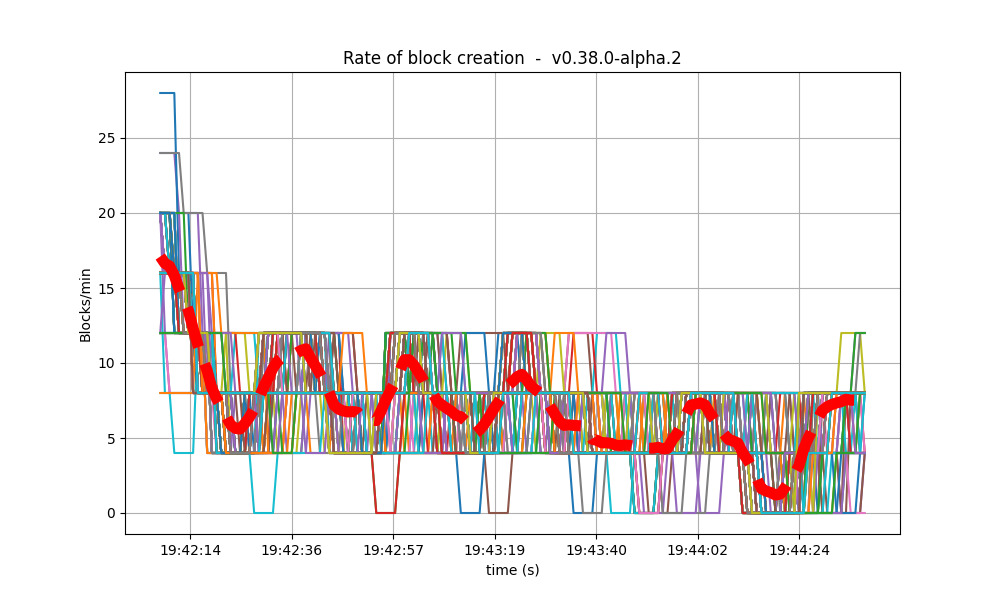 |
 |
| 16k | 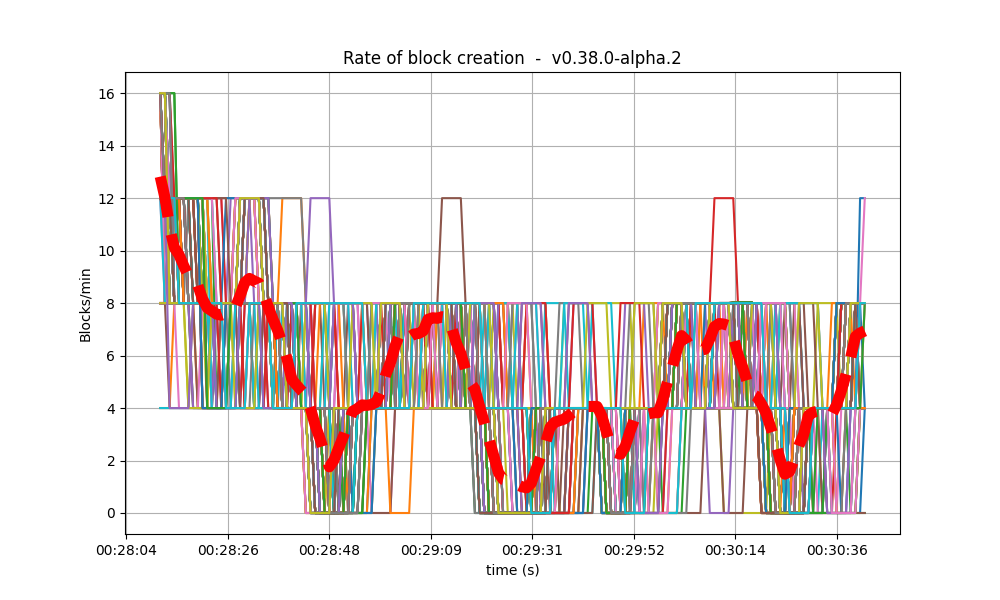 |
 |
| 32k | 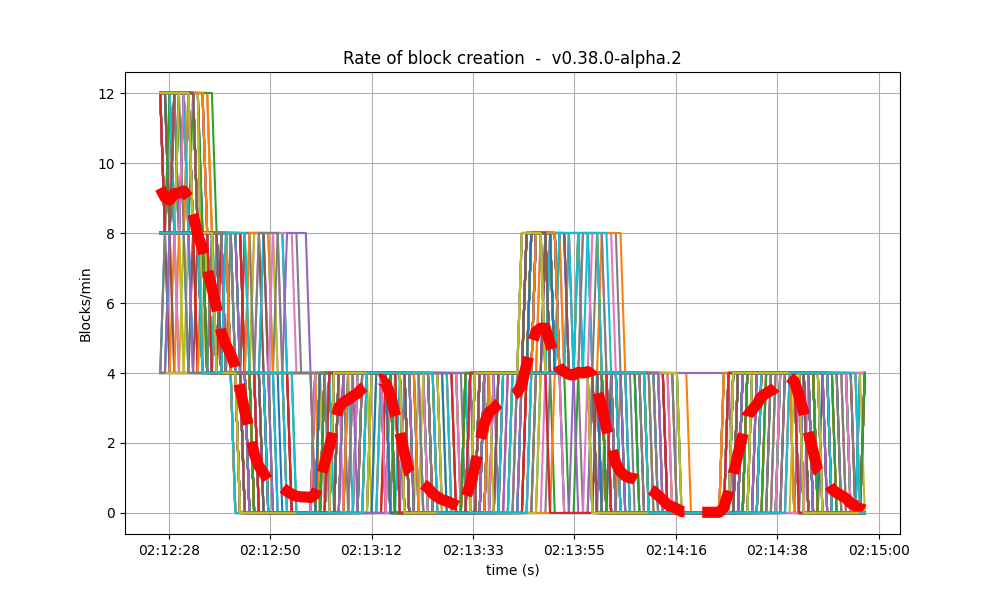 |
 |
Number of rounds
The effect of vote extensions are also felt on the number of rounds needed to reach consensus. The following graphs show the number of the highest round required to reach consensus during the whole experiment.
In the baseline and low vote extension lengths, most blocks were agreed upon during round 0. As the load increases, more and more rounds were required. In the 32k case se see round 5 being reached frequently.
| Experiment | Number of Rounds per block |
|---|---|
| baseline | 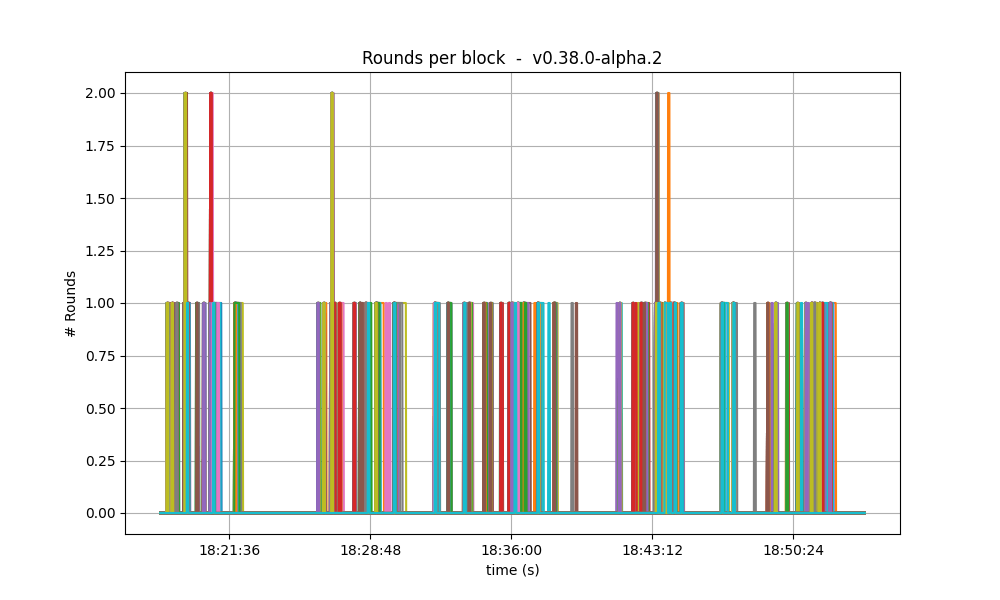 |
| 2k | 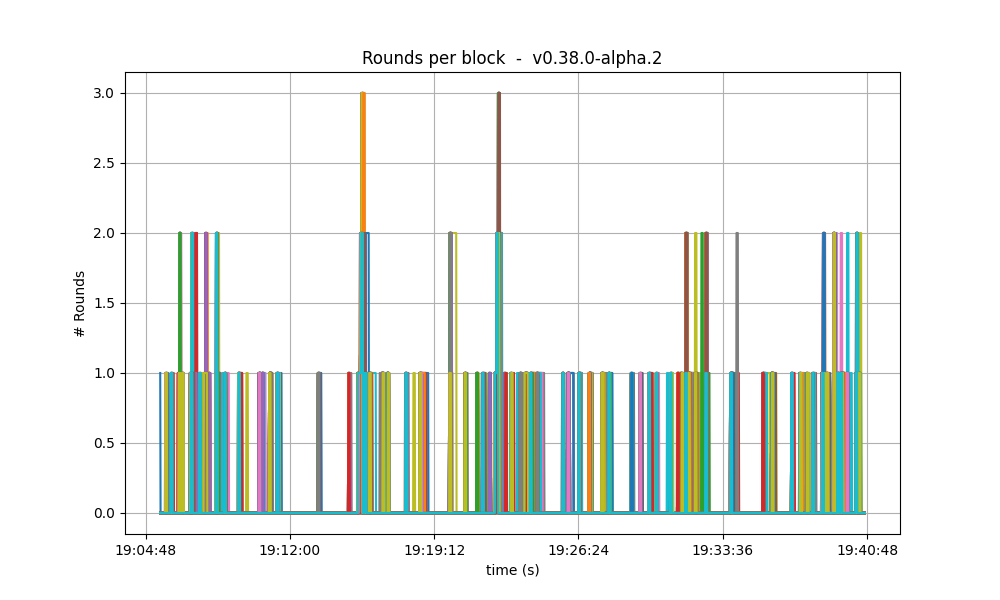 |
| 4k | 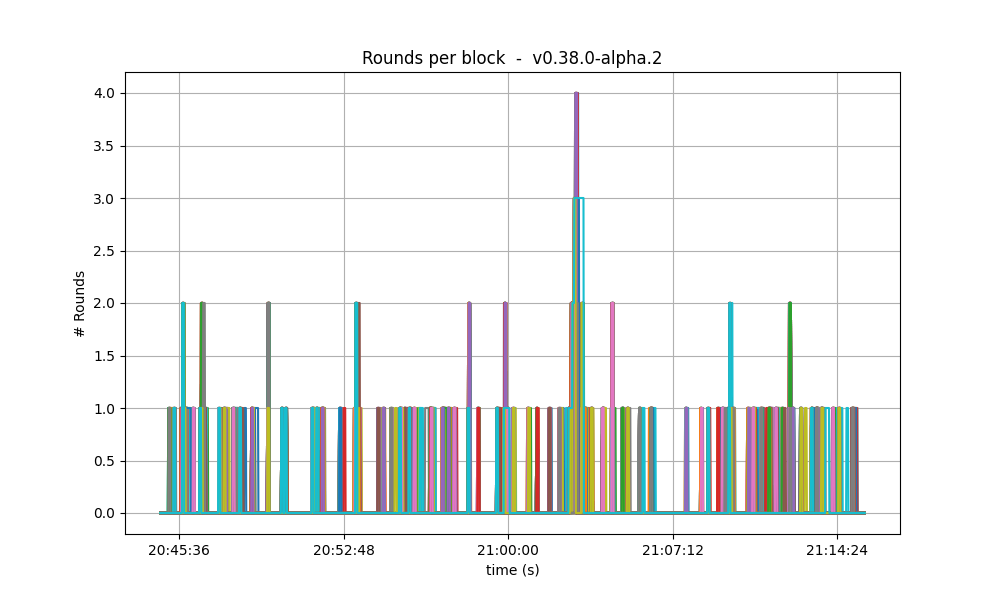 |
| 8k |  |
| 16k | 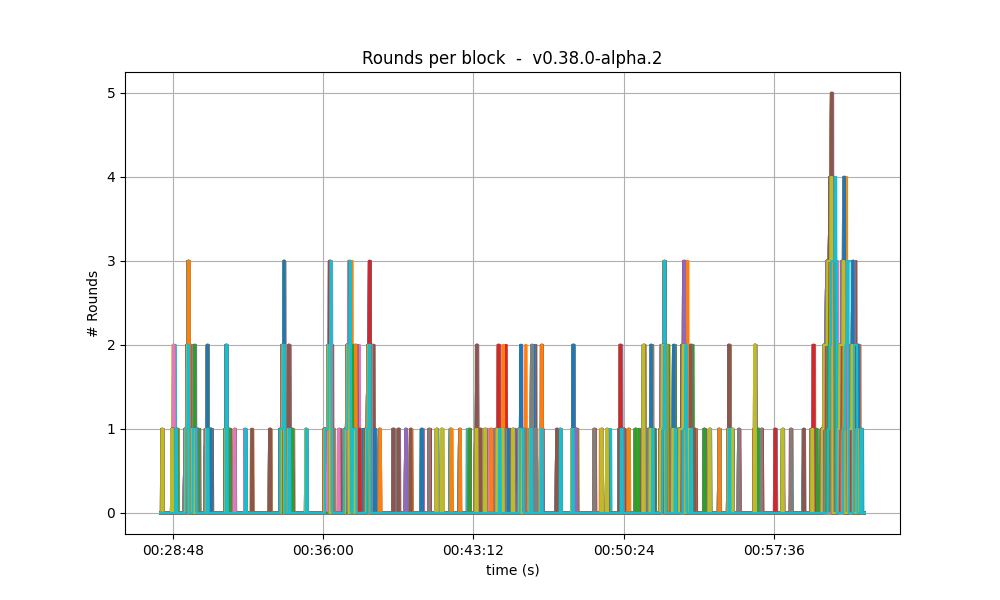 |
| 32k | 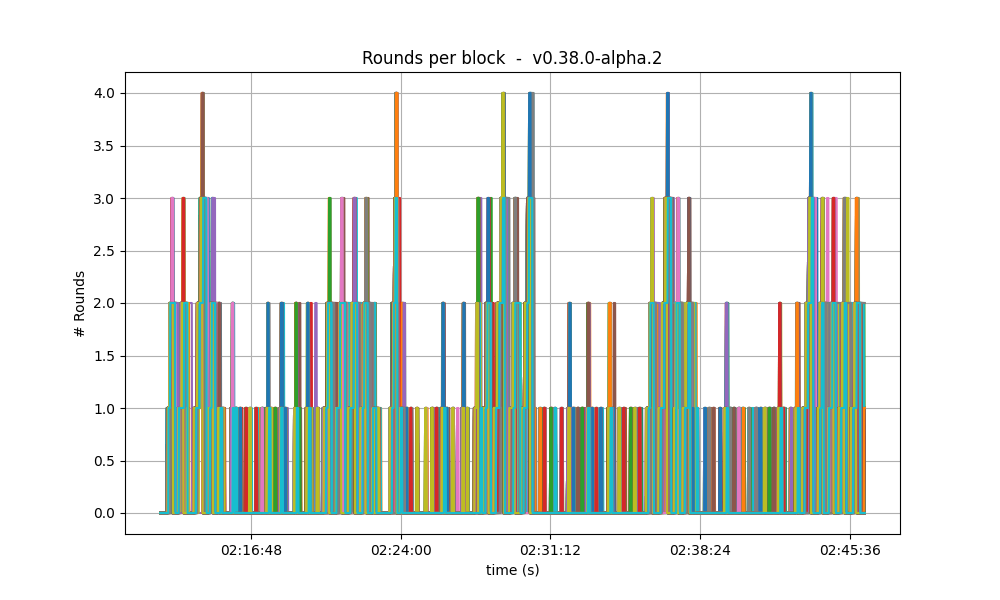 |
We conjecture that the reason is that the timeouts used are inadequate for the extra traffic in the network.
CPU
The CPU usage reached the same peaks on all tests, but the following graphs show that with larger Vote Extensions, nodes take longer to reduce the CPU usage. This could mean that a backlog of processing is forming during the execution of the tests with larger extensions.
| Experiment | CPU |
|---|---|
| baseline | 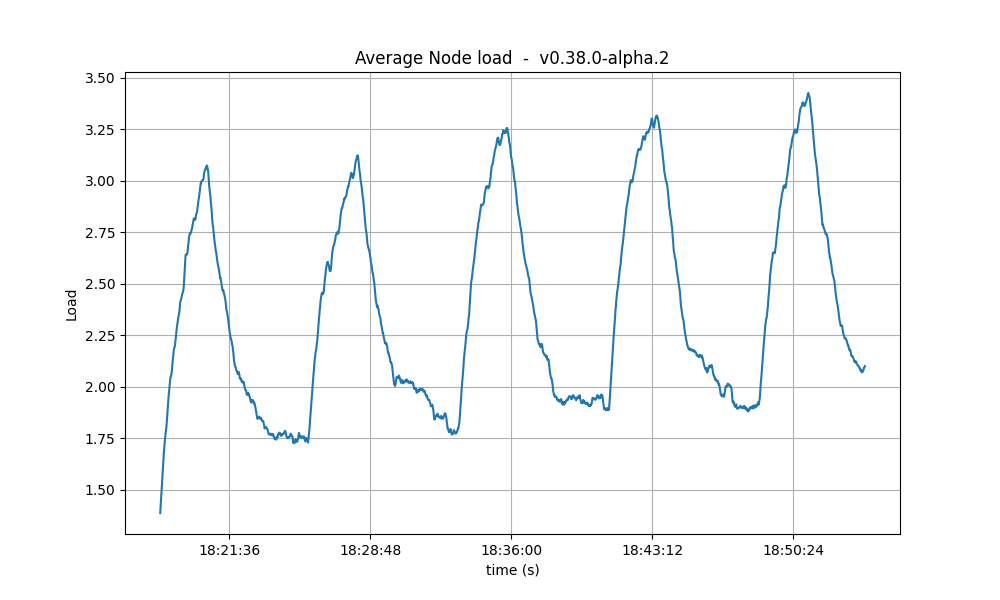 |
| 2k | 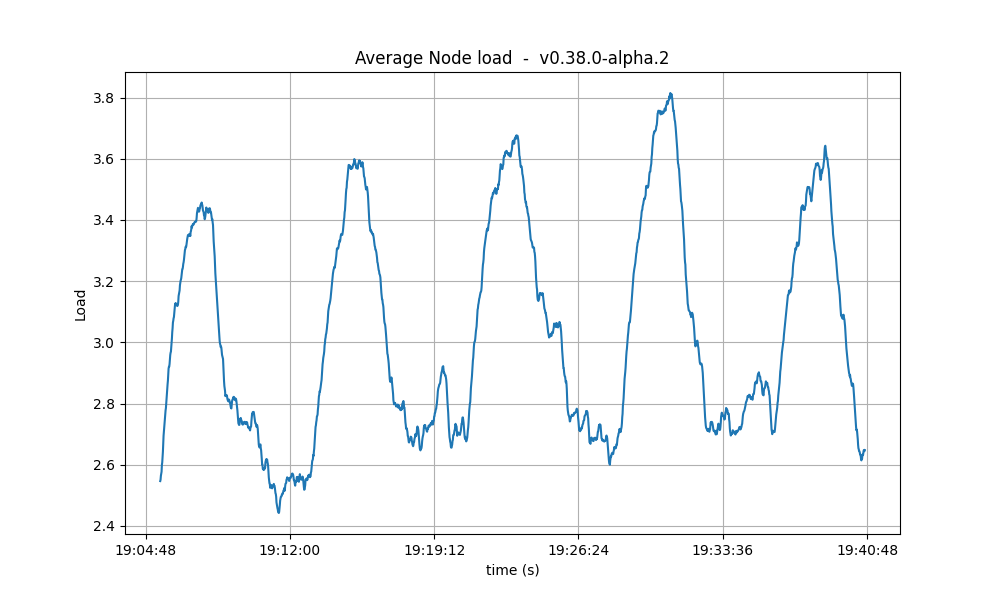 |
| 4k |  |
| 8k | 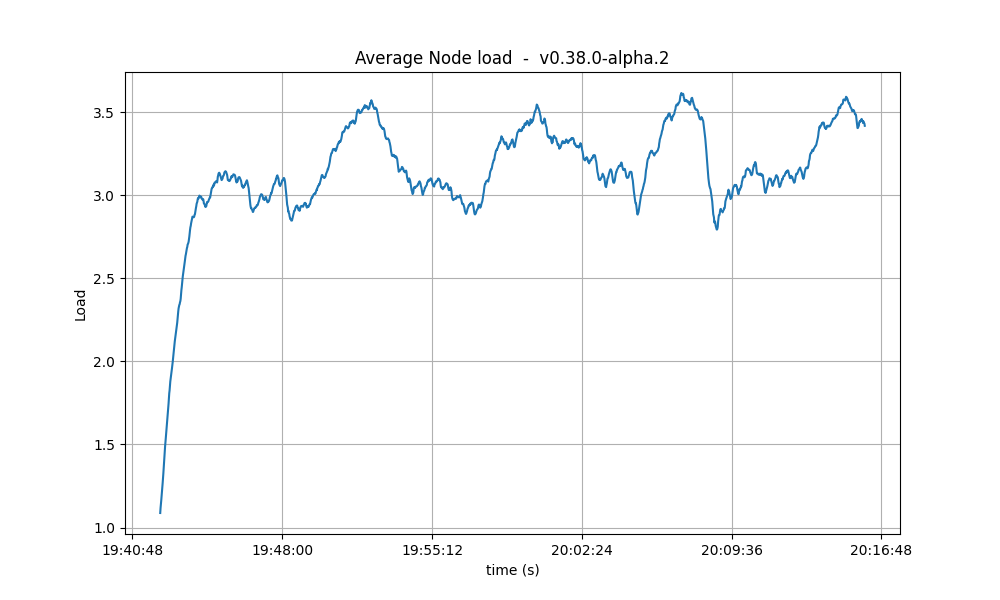 |
| 16k | 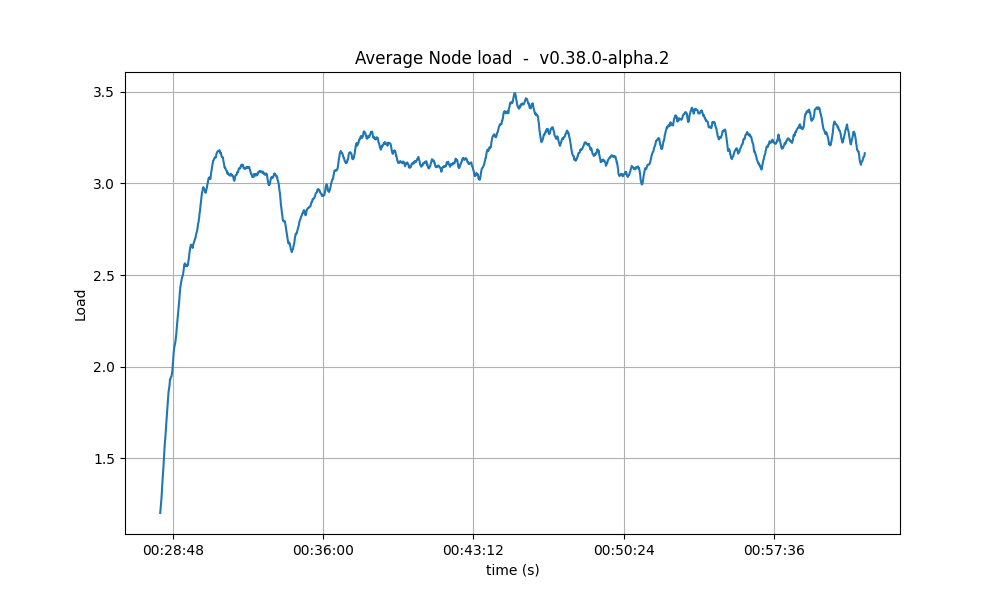 |
| 32k | 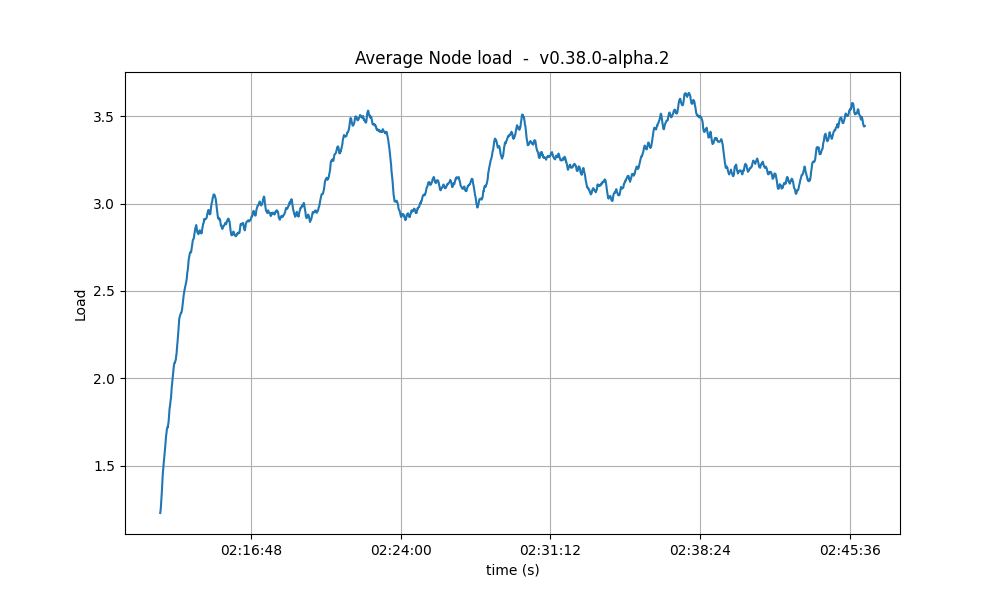 |
Resident Memory
The same conclusion reached for CPU usage may be drawn for the memory. That is, that a backlog of work is formed during the tests and catching up (freeing of memory) happens after the test is done.
A more worrying trend is that the bottom of the memory usage seems to increase in between runs. We have investigated this in longer runs and confirmed that there is no such a trend.
| Experiment | Resident Set Size |
|---|---|
| baseline | 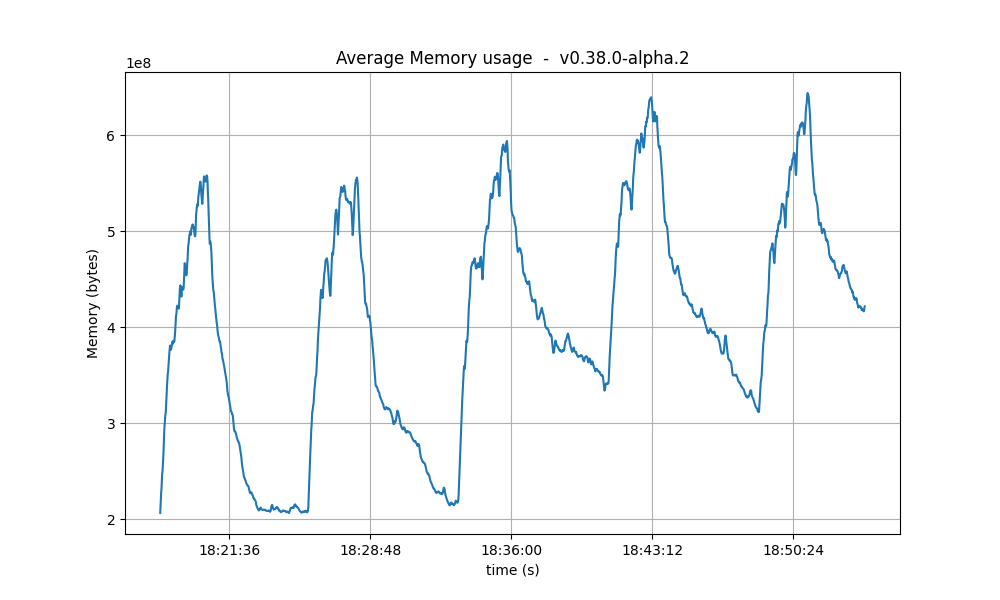 |
| 2k | 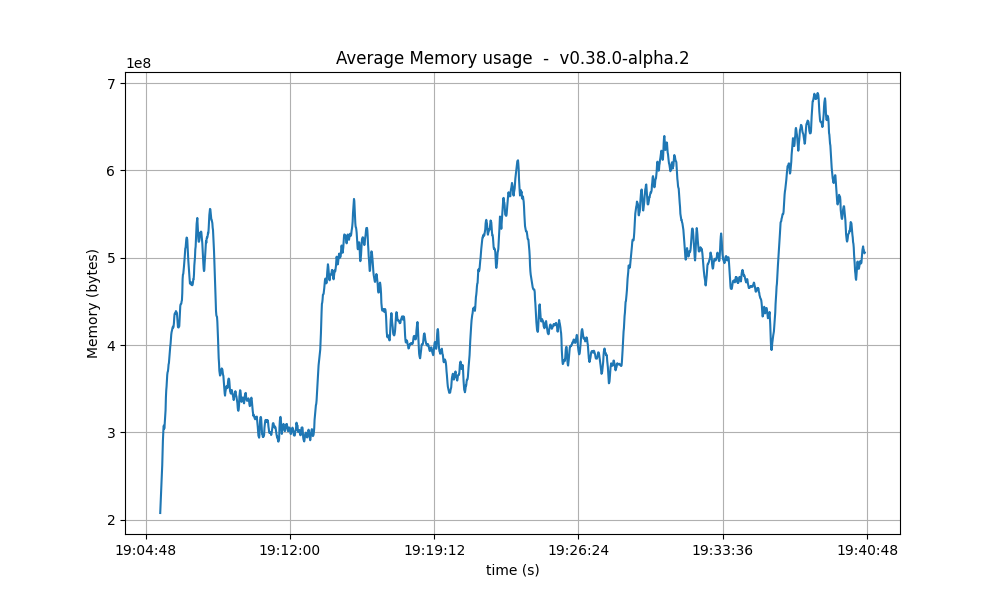 |
| 4k | 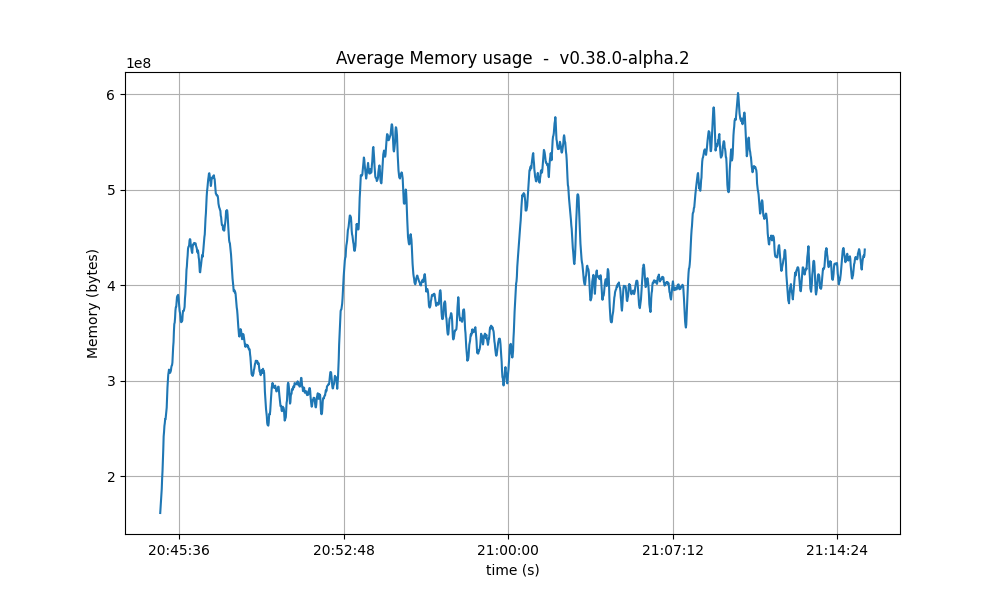 |
| 8k |  |
| 16k |  |
| 32k | 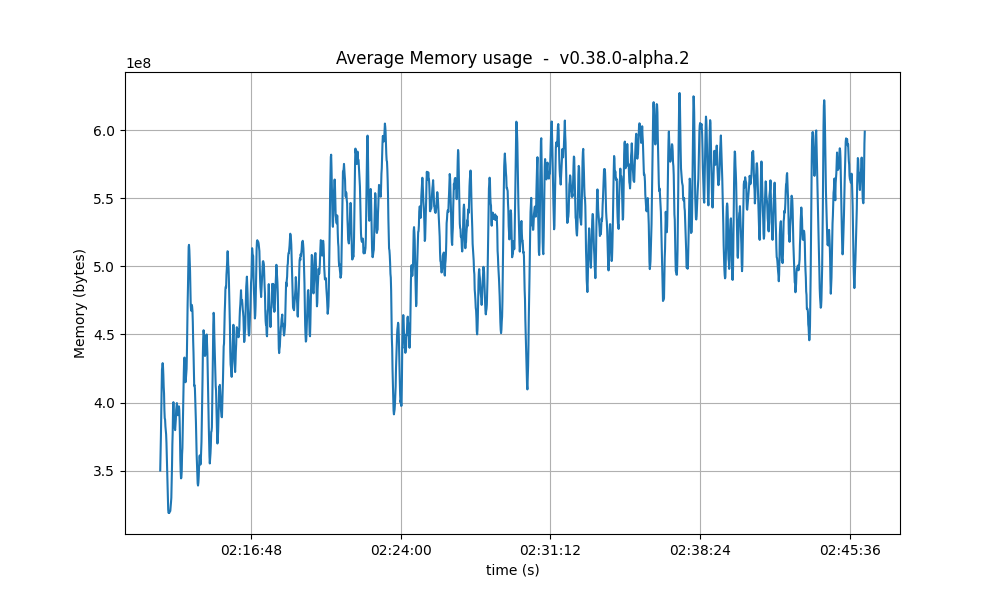 |
Mempool size
This metric shows how many transactions are outstanding in the nodes’ mempools. Observe that in all runs, the average number of transactions in the mempool quickly drops to near zero between runs.
| Experiment | Resident Set Size |
|---|---|
| baseline | 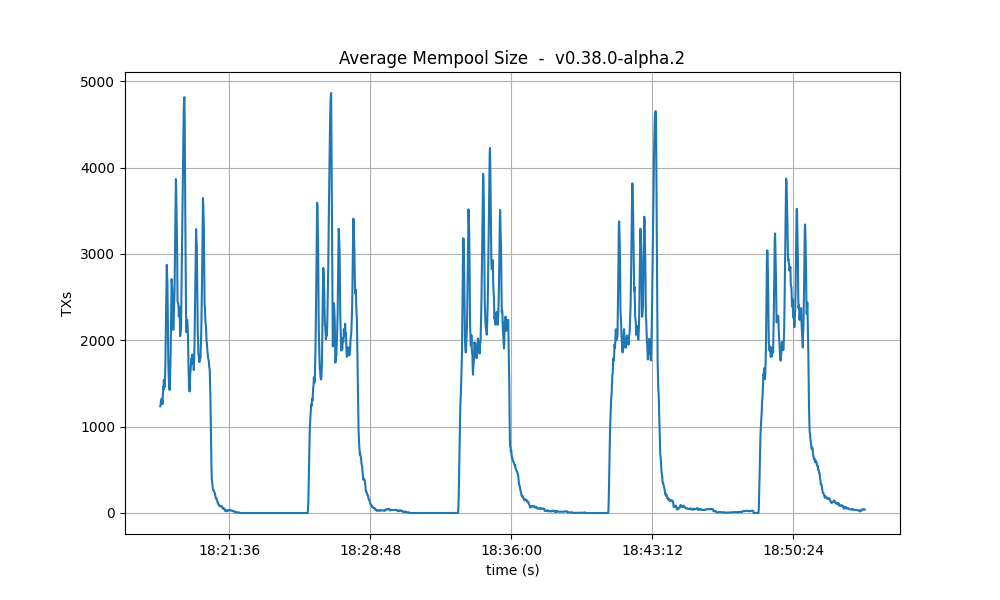 |
| 2k |  |
| 4k |  |
| 8k | 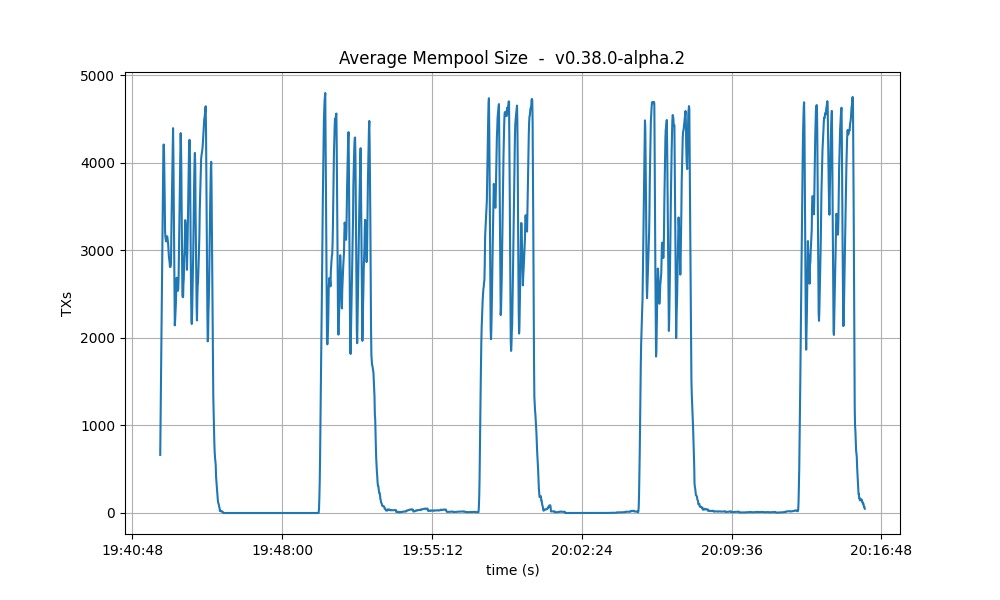 |
| 16k | 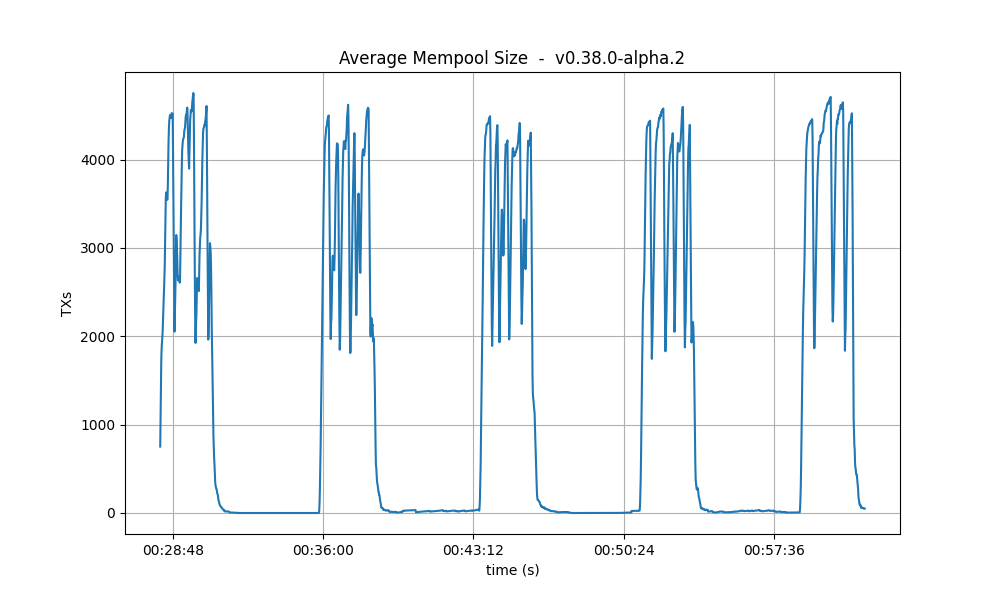 |
| 32k | 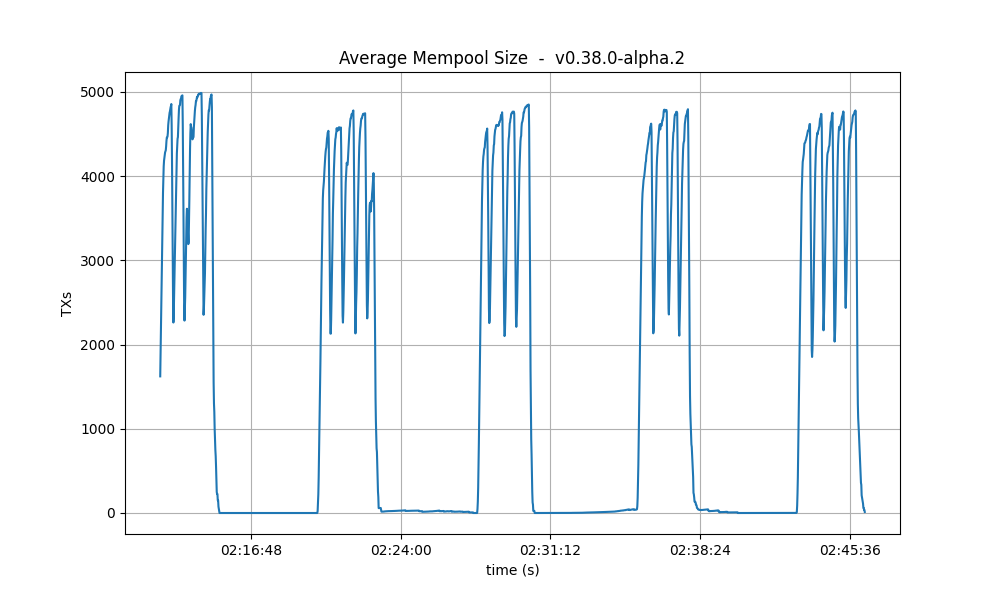 |
Results
| Scenario | Date | Version | Result |
|---|---|---|---|
| VESize | 2023-05-23 | v0.38.0-alpha.2 + varying vote extensions (9fc711b6514f99b2dc0864fc703cb81214f01783) | N/A |
